 Peter Moore
Table of Contents
Crypto charts patterns can seem like cryptic puzzles to the untrained eye. Yet these digital canvases hold valuable clues for traders willing to decipher them. Crypto patterns arise from the collective actions of buyers and sellers, painting a picture of market sentiment and possible future shifts.
Mastering chart analysis isn’t about predicting the future. It’s about recognizing familiar scenarios and being aware of their potential implications. This guide breaks down key crypto chart patterns, from the basic to the complex. We’ll explore how traders employ these visual hints for detecting opportunities, manage risks, and make wiser decisions.
Understanding Chart Patterns in Cryptocurrency Trading
Before we get into the pixel-by-pixel details of each specific pattern, let’s review what chart patterns are and the necessity for being able to read them for a trader.
Introduction to Chart Patterns and Their Importance
Crypto chart patterns are statistical phenomena arising from mass trader behavior. These recurring formations manifest on price charts, offering clues about potential market directions.
The charts typically display graphical elements like candlesticks or bars. These visual representations encapsulate crucial price data for a given interval: the initial value (open), final value (close), peak (high), and trough (low).
The visual formations that emerge on these charts often exhibit recognizable configurations, each potentially indicating future price dynamics. Key components of these formations include directional lines that delineate zones where price movement tends to stall or reverse, known as support and resistance. Various pattern types — such as triangle formations (ascending, descending, symmetrical), head and shoulders, and wedges (rising and falling) — each carry distinct implications for potential bullish or bearish price movements.
Pattern analysis in crypto trading serves as a probabilistic tool. It doesn’t predict outcomes with certainty, but provides a framework for assessing likely scenarios.
Key functions of chart pattern analysis include:
- Momentum evaluation: Gauging the strength of current trends
- Breakout detection: Identifying potential trend initiations
- Reversal recognition: Spotting possible trend exhaustion points
- Risk quantification: Calculating favorable risk-reward ratios
Effective pattern utilization requires understanding their limitations. Traders must consider market context, volume data, and broader economic factors alongside pattern signals.
Pattern proficiency develops through rigorous backtesting and real-time application. It’s an iterative process, demanding continuous refinement as market dynamics evolve.
Overview of Successful Crypto Chart Patterns
Crypto chart patterns vary in their predictive power, with some formations proving more reliable than others in digital asset markets. These patterns often diverge from traditional stock market equivalents due to crypto’s unique volatility and 24/7 trading environment.
High-impact patterns in crypto trading include:
- Bullish/bearish engulfing candles
- Three-drive patterns
- Harmonic patterns (e.g., Gartley, Butterfly)
- Island reversals
- Wyckoff accumulation/distribution phases
Effectiveness often correlates with timeframe; patterns on higher time frames typically carry more weight. Volume confirmation remains crucial, as low-volume breakouts frequently lead to false signals.
In the realm of cryptocurrency analysis, chart patterns generally segregate into two primary groups: trend reversal formations and trend continuation structures. Reversal formations act as potential harbingers of an upcoming trend shift, while continuation structures suggest the ongoing trend is likely to maintain its current course.
Here are a few successful chart patterns commonly used in crypto trading:
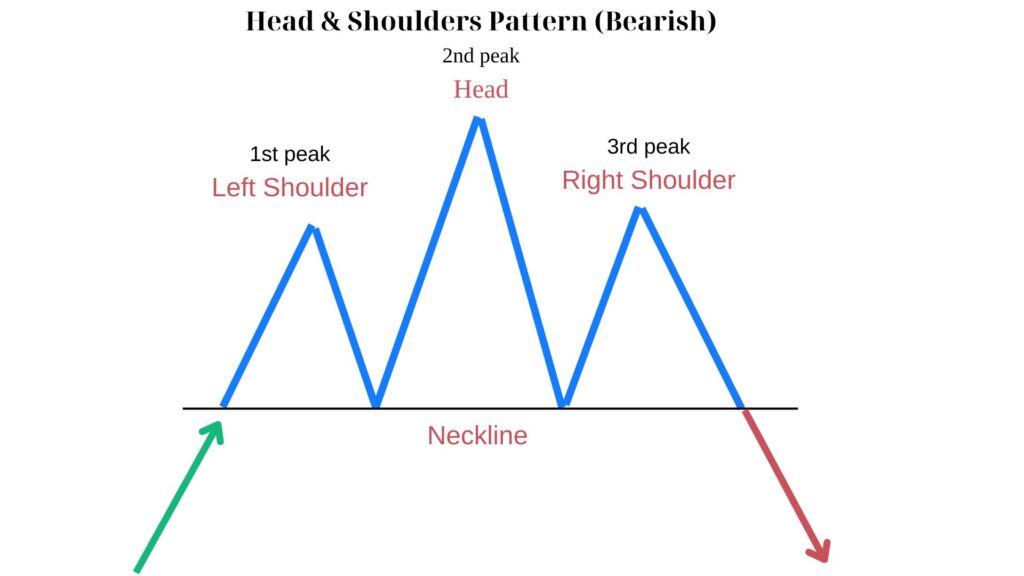
- Head and Shoulders: The Mountain Range
Imagine a mountain range with three peaks — a central summit flanked by two smaller ones. This is the essence of the Head and Shoulders pattern. When this geological formation appears on your chart, it often whispers of bearish winds to come, suggesting the bulls are running out of steam.
- Double Top and Bottom: The Double Take
Sometimes, the market tests a level twice. This creates the Double Top or Double Bottom patterns. These repeated attempts at breaching a level, followed by retreat, often signal a potential reversal as if the market has thought twice about its direction.
- Bull and Bear Flags: Pennants in the Wind
In the midst of a strong trend, you might spot what looks like a flag fluttering in the wind. These Bull and Bear Flags represent brief pauses in the action, like sprinters catching their breath before the final dash. They often precede a continuation of the prevailing trend.
- Triangle Patterns: The Narrowing Path
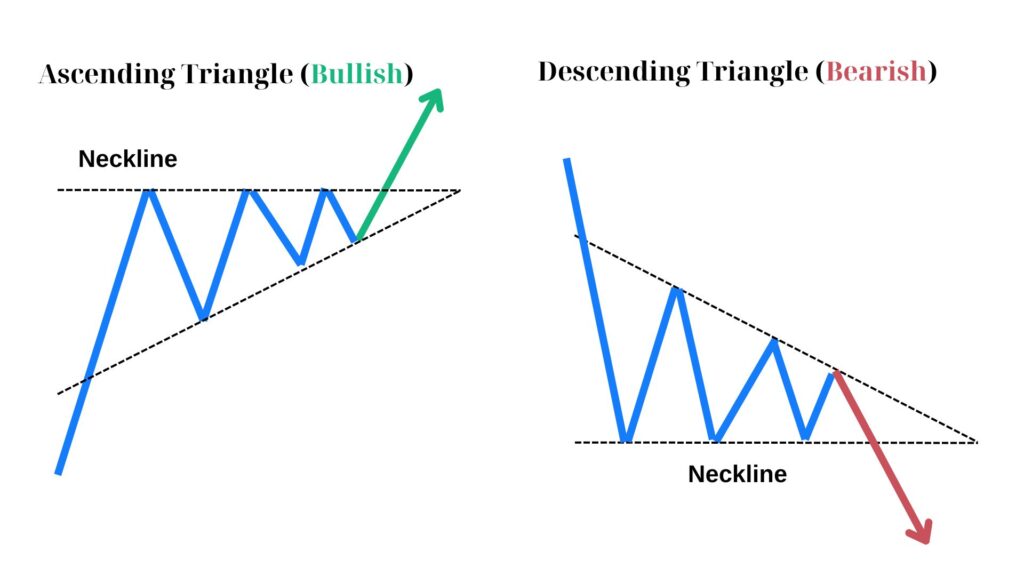
As buyers and sellers reach a stalemate, price can become constricted between converging trendlines, forming Triangle patterns. Like a coiled spring, these patterns often resolve in explosive breakouts, with Ascending Triangles typically bullish and Descending Triangles bearish.
- Cup and Handle: The Drinker’s Delight
The Cup and Handle pattern, resembling a teacup on its side, often signals a bullish continuation. It’s as if the market takes a refreshing sip before continuing its upward journey.
- Converging Wedges: Directional Compression Patterns
Wedge formations, both descending and ascending, represent key transitional or continuity signals defined by narrowing price boundaries. In a descending wedge, the price trajectory establishes successively reduced peaks and troughs within a tapering channel. Counterintuitively, this downward-angled configuration frequently heralds an upward shift, particularly when manifesting during a broader decline.
Traders should focus on mastering a select few patterns rather than attempting to utilize every formation. This specialized approach allows for deeper understanding and more nuanced application in varied market conditions.
Exploring Real-time Examples of Chart Patterns
Real-time chart pattern analysis in crypto markets demands keen observation and swift interpretation. Unlike historical examples, live patterns are dynamic, often morphing or invalidating as new price action unfolds.
Key aspects of real-time pattern exploration:
- Pattern inception: Identifying potential formations in their early stages
- Confirmation points: Pinpointing crucial levels that validate or negate a pattern
- False breakouts: Distinguishing between genuine pattern completions and market fakeouts
- Time compression: Recognizing how patterns behave differently across various timeframes
Traders must remain vigilant, as crypto markets can rapidly shift due to factors like:
- Sudden news events
- Large-scale on-chain transactions
- Cascading liquidations
Real-time pattern trading involves balancing patience with decisive action. Premature entries can lead to losses, while hesitation may result in missed opportunities.
Here are the patterns currently observed on some well-known coin charts:
Falling Wedge Pattern (ZEC):

ZEC’s price action forms a distinctive wedge, narrowing downwards. This compression suggests a buildup of bullish potential energy, with the blue-circled area marking a critical juncture where buyers may overpower the prevailing downtrend.
Descending Triangle (LTC):
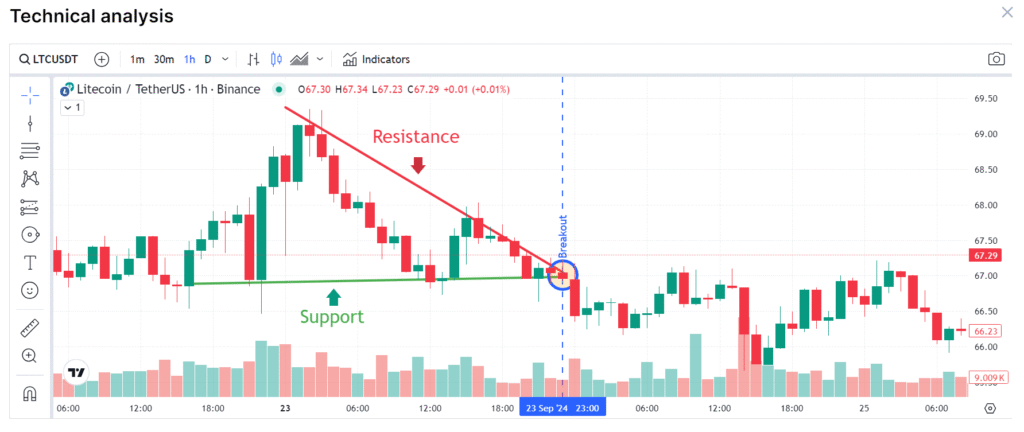
LTC exhibits a struggle between stubborn support and weakening resistance. The brief upward probe followed by a sharp decline illustrates the delicate balance of forces at play, hinting at continued bearish dominance.
Descending Channel Pattern (EOS):
The EOS/USD pair is showing signs of a potential upward trajectory, as it appears to be concluding its movement within a downward-sloping channel. This chart draws us parallel trendlines angling downwards, that often signals a bullish reversal when the price breaches the upper boundary. In this case, we’ve witnessed just that – a breakout above the channel’s resistance line.
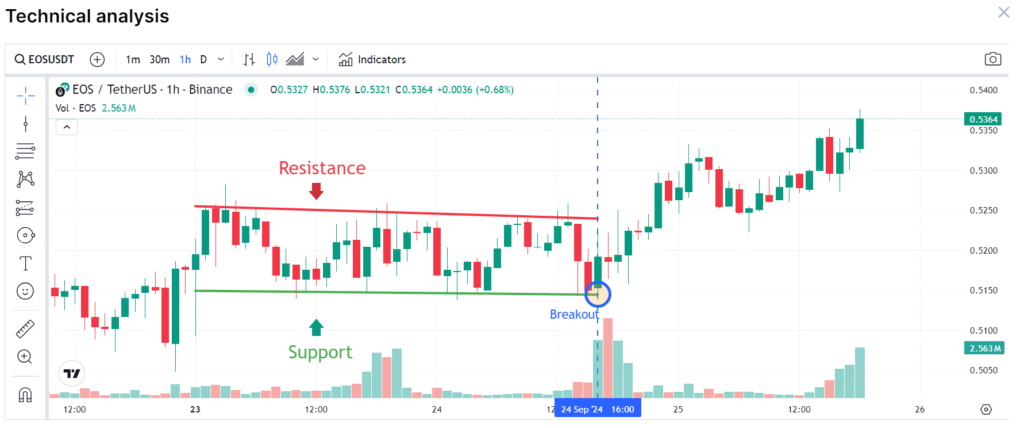
This development has sparked optimism among traders, who are now anticipating a continued ascent. The next key level to watch is the 0.5400 mark, which could serve as a near-term target for this budding uptrend. The recent price action seems to validate the reliability of this bullish crypto pattern, as the asset’s value has indeed started to climb following the breakout event.
Ascending Channel Pattern (ETH):
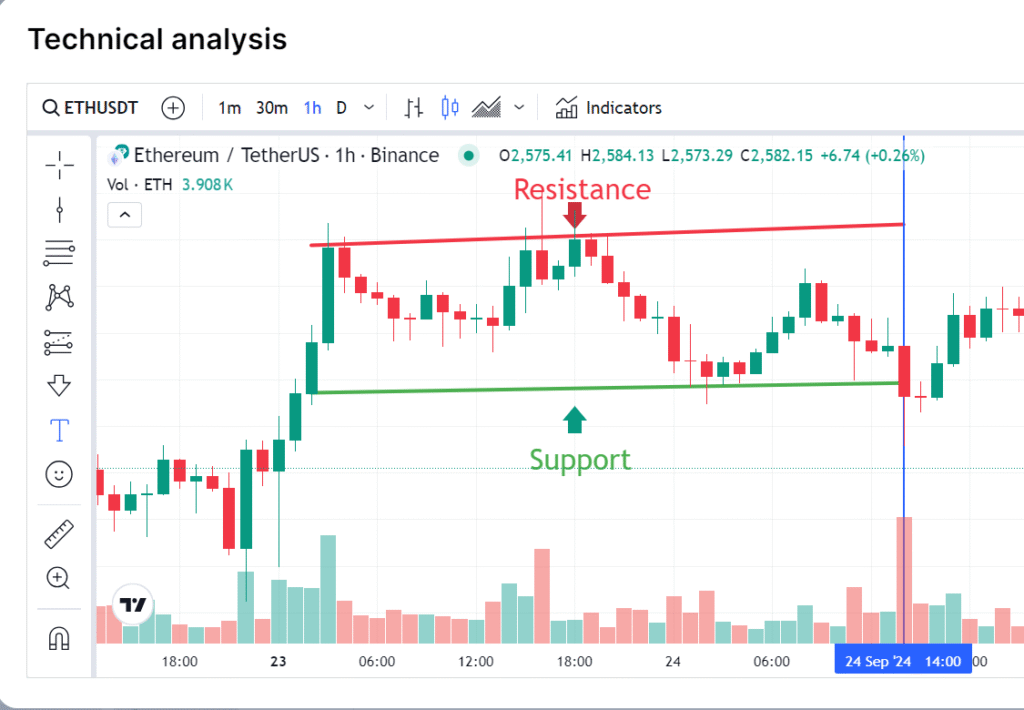
ETH’s price carves out a rising channel, a formation that paradoxically often presages a downward break. Traders eye the $2600 level as a possible target should bears breach the lower boundary.
Reversed Head-and-Shoulders Pattern (BNB):
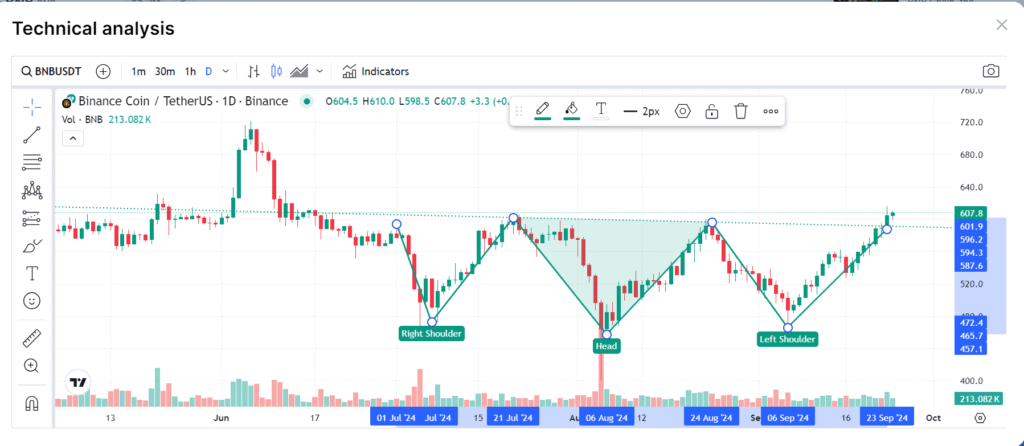
BNB presents perhaps the most complex pattern — a reversed head-and-shoulders. This triple-dip formation, with its lowest point in the middle, often signals a bearish-to-bullish reversal. Key levels at $560 and $530 serve as crucial pivot points for this potential trend change.
Common Chart Patterns Used in Crypto Trading
For those who are new to crypto trading patterns, it is better to start with patterns that are easy to spot and interpret.
Head & Shoulders Pattern and Its Significance
The head and shoulders pattern is a trader’s favorite in crypto. It’s easy to spot. You see three peaks. The middle one is the highest. That’s the head. The other two are the shoulders. When you see this, the price might drop soon.
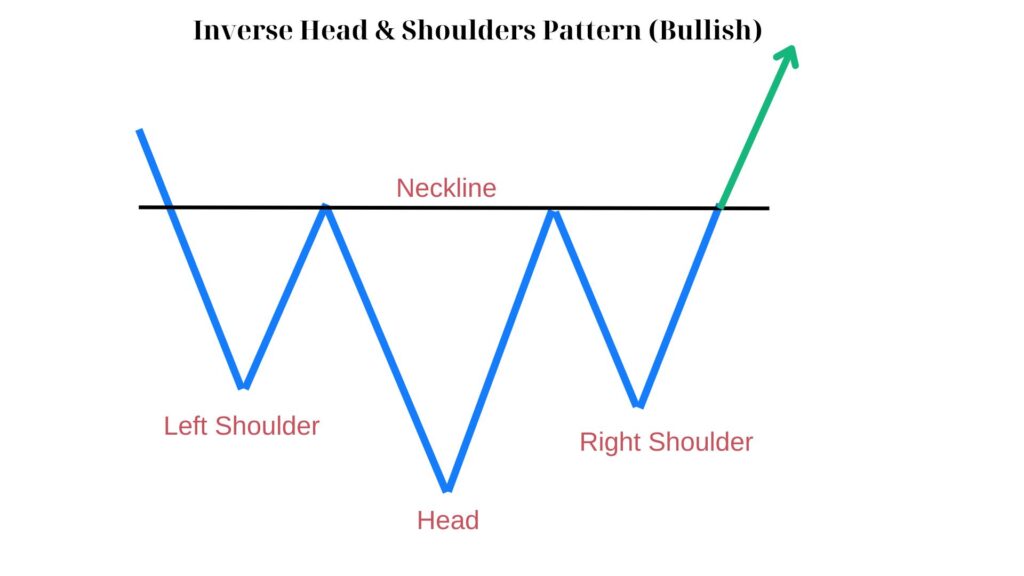
But wait, there’s a flip side. It’s called the inverse head and shoulders. It looks like the regular pattern, but upside down. You see three dips instead of peaks. The middle dip is the lowest. This pattern often means prices might go up.
Unlike traditional markets, this pattern in crypto often develops at a more rapid pace, reflecting the market’s 24/7 nature. Crypto traders have observed that the “neckline” in these formations frequently acts as a dynamic zone rather than a static line. The pattern’s completion in digital asset markets can trigger cascading effects due to the prevalence of algorithmic trading and stop-loss orders. Savvy crypto enthusiasts often combine this pattern analysis with exchange order book depth to gauge potential reversal strength.
Double Top and Bottom Patterns
Double tops and bottoms crypto graph patterns are simple but powerful. For double tops, the price hits a high point twice. It’s like the price is knocking on a ceiling. This often means the uptrend is running out of steam.
Double bottoms are the opposite. The price hits a low point twice, and this can signal the end of a downtrend.

Double Top and Bottom patterns often coincide with significant psychological price levels, such as previous all-time highs or round number thresholds. These formations in digital asset markets can be more pronounced due to the influence of retail traders and social media sentiment.
Ascending and Descending Triangle Patterns
Triangles are all about narrowing ranges. In an ascending triangle, the top is flat. The bottom line slopes up. It’s like the price is slowly gathering strength for a breakout.
Descending triangles are the reverse. The bottom is flat. The top line slopes down. This often means selling pressure is building up.
Triangle patterns in crypto markets often represent periods of accumulation or distribution by large players, colloquially known as “whales.” These formations can be particularly potent when they develop on higher timeframes, as they frequently precede significant moves amplified by the leveraged trading common in crypto markets.
Bullish and Bearish Flag Patterns
Flags are short-term patterns. They look like a flag on a pole. The pole is a strong price move. The flag is a pause.
Bullish flags slope down a bit, but they often lead to more upward movement. Bearish flags slope up slightly and usually continue the downtrend.
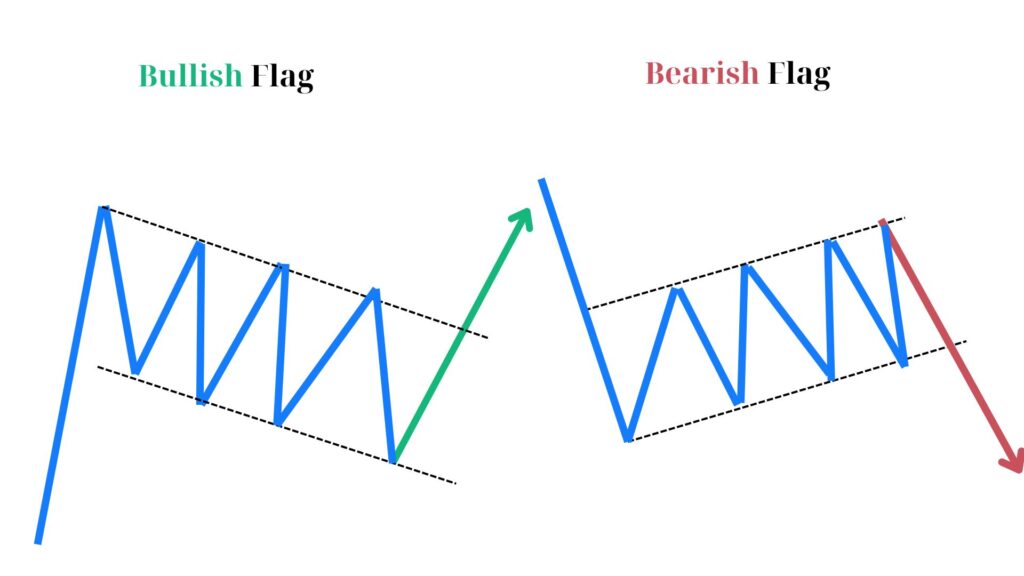
In the fast-paced crypto environment, flag patterns often form and resolve more quickly than in traditional markets. These brief consolidation periods in strong trends are frequently driven by quick profit-taking or short-term counter-trend trades.
Wedge Patterns: Rising and Falling Variations
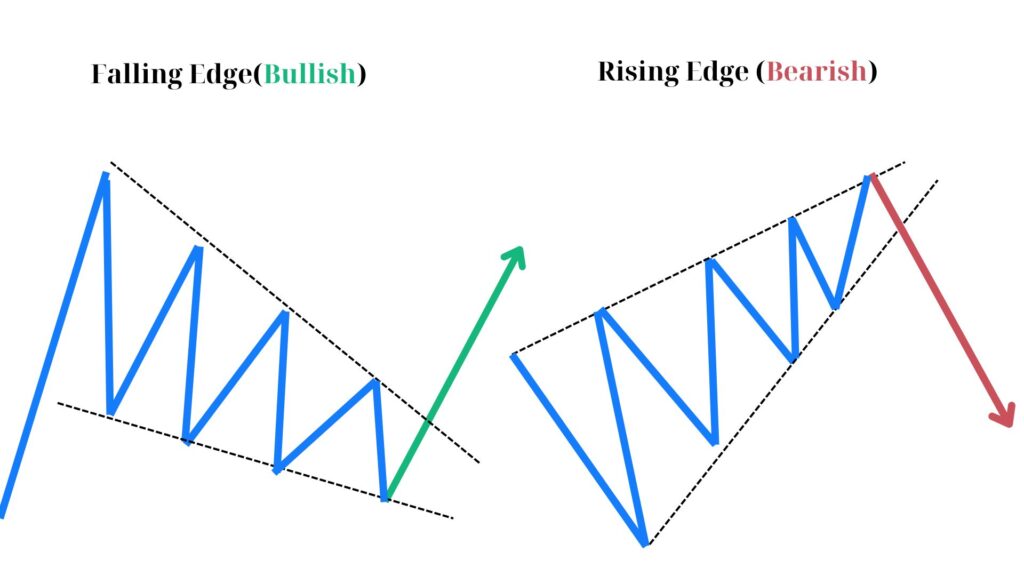
Wedges are like triangles, but both lines slope the same way. A rising wedge in an uptrend is often bearish, while a falling wedge in a downtrend is usually bullish. Wedge patterns in crypto charts often precede explosive price movements, partly due to the market’s susceptibility to sudden influxes of capital or regulatory news. Rising wedges in crypto uptrends and falling wedges in downtrends are particularly noteworthy, as they can signal potential trend exhaustion more reliably than in other markets.
Crypto traders have developed strategies to combine wedge analysis with sentiment indicators and exchange inflow/outflow data for a more comprehensive view. The resolution of wedge patterns in crypto can often lead to significant volatility spikes, making them crucial formations for traders to monitor.
Cup & Handle Pattern and Its Trading Implications
The cup and handle is a bullish crypto pattern. It looks like, well, a cup with a handle. The cup is a U-shape. The handle is a slight downward drift.
In crypto, these patterns can take a while to form. They’re more common in longer timeframes. The breakout from the handle can be powerful.
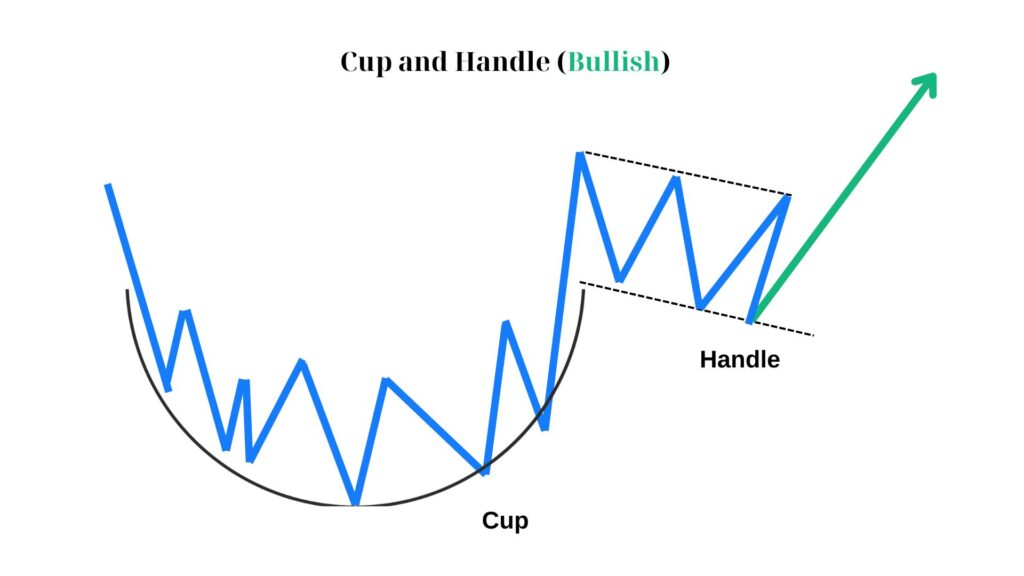
Crypto traders pay special attention to the volume profile during the cup’s formation and the depth of the handle, which can provide insights into potential breakout strength. In the volatile crypto market, the handle portion of this pattern can sometimes experience more significant price swings compared to traditional markets, requiring traders to adjust their interpretation accordingly.
Understanding Rounding Top and Bottom Patterns
Rounding patterns are smooth. A rounding top looks like an upside-down U and often means a bearish reversal is coming. A rounding bottom is U-shaped and suggests a bullish reversal.
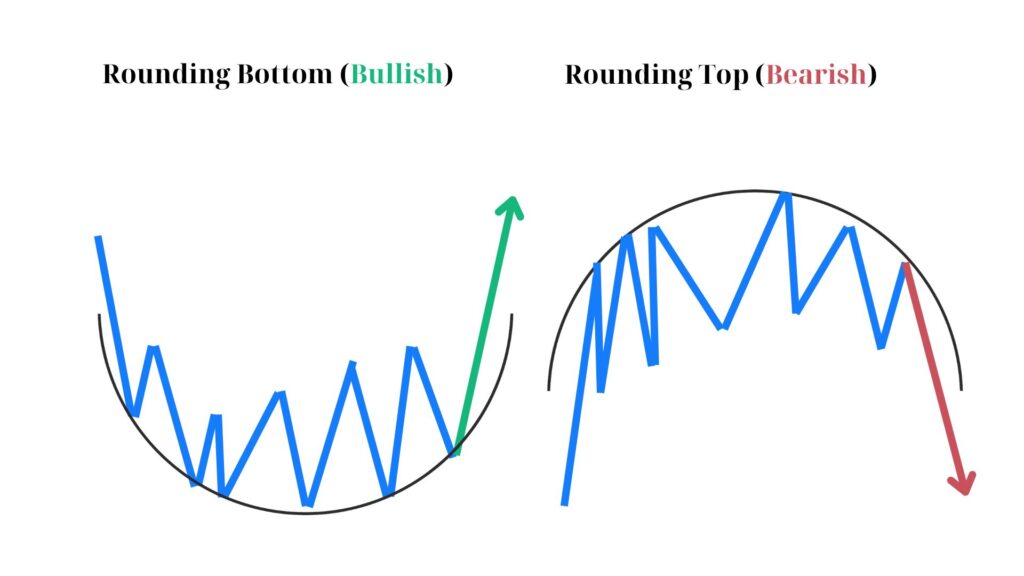
These patterns can be less distinct in crypto due to the market’s inherent volatility, requiring traders to examine longer timeframes and consider fundamental factors like network activity or development milestones.
Rectangle Patterns and Their Role in Trading
Rectangles are all about consolidation. The price bounces between support and resistance. It’s like the market is taking a breather.
These patterns can be particularly significant when they form after major price movements, as they may indicate smart money positioning before the next big move.
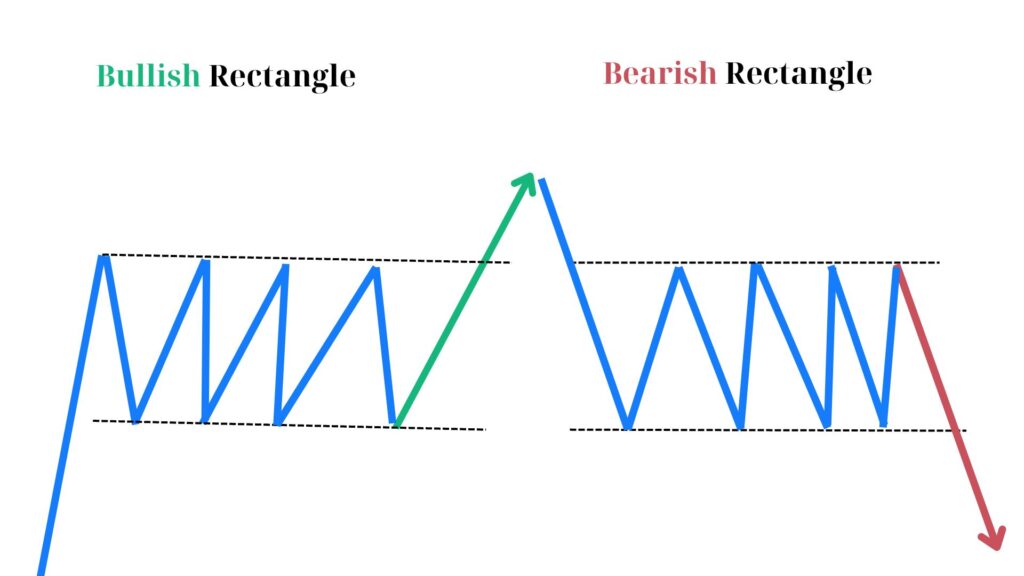
Crypto traders frequently analyze order book depth and trading volume distribution within the rectangle to gauge potential breakout directions. The resolution of rectangle patterns in crypto can sometimes be more dramatic than in traditional markets, often leading to rapid price expansions due to the market’s liquidity characteristics and the prevalence of leveraged trading.
Advanced Crypto Chart Patterns
Mastering the subtleties of advanced crypto chart patterns is akin to achieving fluency in a complex language. For traders who can decipher these sophisticated market signals, it’s like operating at a C1 level of proficiency in the world of digital asset analysis.
Triple Top and Bottom Patterns
Triple Tops and Bottoms in crypto charting are the epitome of complex price patterns rare, intricate, and often misunderstood. These formations challenge even seasoned traders, appearing as a trio of price rejections at key levels. Unlike more common patterns, these configurations reveal themselves slowly over weeks or months.
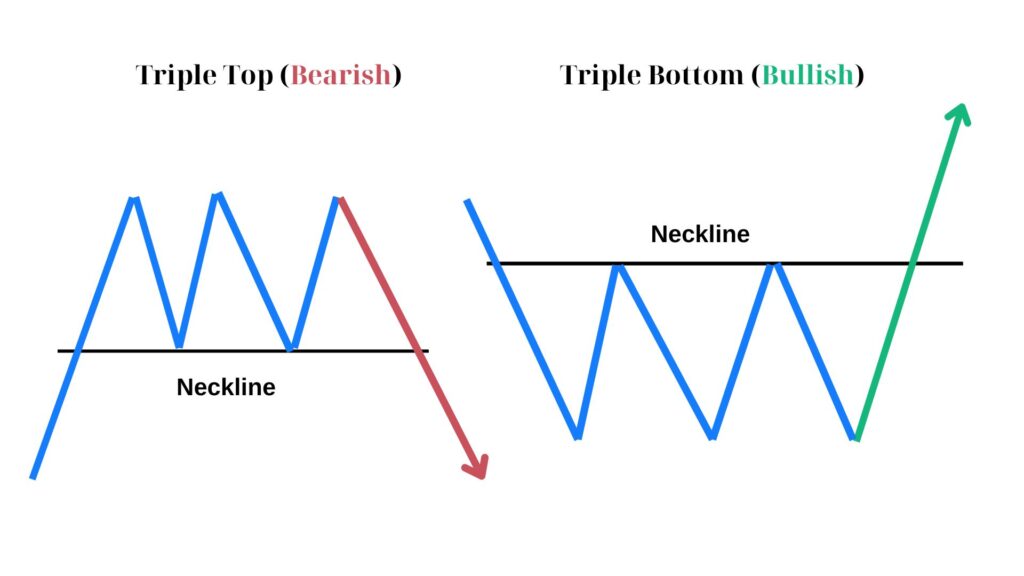
They’re not just about price — savvy crypto analysts dive deep into volume profiles and time intervals between peaks or troughs. When valid, these patterns can foreshadow dramatic reversals, but beware in the topsy-turvy world of digital assets, false signals abound. Mastering these elusive formations separates the crypto elite from the pack.
Bullish and Bearish Pennant Patterns
Bullish and Bearish Pennants in crypto markets are fleeting moments of tension, capturing the clash between momentum and hesitation. These compact patterns materialize when a strong price thrust meets a brief period of indecision. In the cryptosphere, pennants often form in the blink of an eye, challenging traders to spot and act swiftly. The pattern’s apex becomes a focal point of energy, with decreasing volume hinting at a coiled spring ready to unwind.
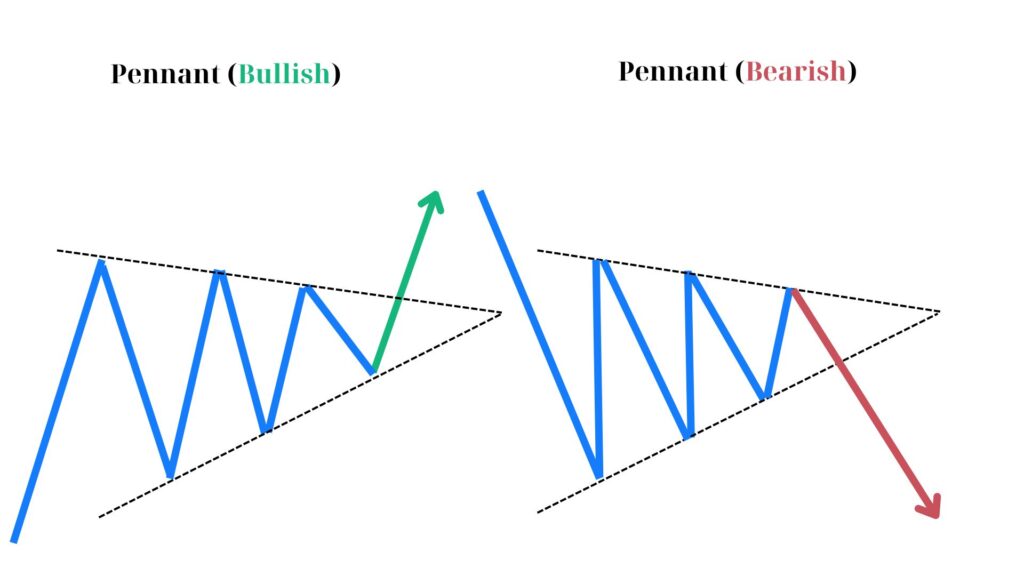
Savvy crypto analysts don’t just eye the pattern, but dissect the preceding move’s character and surrounding market context. Pennants in digital assets can be particularly deceptive, sometimes morphing into different formations or fizzling out entirely, making them a true test of a trader’s pattern recognition prowess.
Exploring the ABCD Pattern and Its Application
The ABCD pattern in crypto trading is a geometric marvel, a rhythmic dance of price swings that captivates technical enthusiasts. Unlike its alphabetical simplicity suggests, this formation demands a nuanced understanding of proportions and timing. In the volatile crypto realm, ABCD patterns materialize across various timeframes, offering a structured approach to chaos.

Savvy digital asset traders don’t merely connect the dots; they delve into the pattern’s internal ratios, often incorporating Fibonacci retracements to fine-tune entries and exits. The pattern’s power lies in its ability to predict potential reversals and continuations alike, a chameleon-like quality that keeps traders on their toes. Mastering ABCD analysis in crypto markets requires a blend of geometric precision and adaptability to rapid market shifts.
How to Trade Crypto Using Chart Patterns
Now that we know what formations to look for on cryptocurrency charts, we need to understand how they will help us earn. Below are the best practices and techniques for trading using patterns.
Strategies for Utilizing Chart Patterns in Trading
Decoding crypto’s geometric language demands more than pattern spotting — it’s an art of interpretation and timing. Consider these key strategies:
- Pattern Validation: Confirm multiple touchpoints Assess pattern completeness Evaluate surrounding price action
- Entry Timing: Wait for breakout confirmation Consider volume as a validation tool Use smaller timeframes for precision
- Risk Management: Set clear stop-loss levels Calculate risk-reward ratios Size positions based on potential drawdown
- Confluence Factors: Align with broader market trends Incorporate supporting indicators Consider fundamental catalysts
Remember, in crypto’s volatile landscape, rigid pattern rules can be a trap. Cultivate a flexible, innovative approach to stay ahead of the game.
Factors Affecting the Success Rate of Chart Patterns
Crypto trading patterns are not infallible oracles, but rather probabilistic guides. Their success hinges on a complex interplay of factors:
- Market Maturity: Newer cryptocurrencies often exhibit erratic pattern behavior Established coins tend to form more reliable patterns Market cap influences pattern adherence.
- Liquidity Dynamics: Low liquidity can skew pattern formation and breakouts Whale movements may distort pattern integrity DEX vs CEX trading affects pattern reliability.
- Technological Shifts: Protocol upgrades can render historical patterns obsolete Forking events may create pattern anomalies Layer-2 solutions impact underlying asset patterns.
- Regulatory Climate: Regulatory news can abruptly invalidate forming patterns Jurisdictional differences create pattern divergences Compliance shifts alter institutional trading patterns.
Success lies in synthesizing these factors with ever-evolving market dynamics.
Risk Management Techniques for Crypto Traders
In the high-stakes arena of crypto trading, risk management isn’t just a safety net – it’s the foundation of longevity. Consider these unconventional approaches:
- Volatility-Adjusted Positioning:
- Scale position sizes inversely to asset volatility
- Implement dynamic stop-losses based on Average True Range
- Use volatility breakouts as entry/exit triggers
- Correlation-Based Hedging:
- Exploit negative correlations between crypto assets
- Utilize stablecoin pairs for temporary risk offsets
- Incorporate DeFi options for sophisticated hedging
- Psychological Circuit Breakers:
- Set personal ‘cool-down’ periods after significant losses
- Implement mandatory reflection sessions post-winning streaks
- Use mindfulness techniques to combat FOMO and panic selling
- Blockchain-Informed Risk Assessment:
- Monitor on-chain metrics for early warning signs
- Adjust exposure based on network health indicators
- Factor in upcoming protocol changes in risk calculations
Remember, in crypto’s digital colosseum, survival often trumps profit. Cultivate a risk management mindset that evolves with the market’s pulse.
Practical Tips for Pattern Trading in Cryptocurrency
Pattern trading in cryptocurrency markets presents unique challenges and opportunities for savvy traders. The following practical suggestions can help you navigate the complexities of applying chart patterns to digital assets.
Identifying Trends and Patterns in Cryptocurrency Charts
Decoding crypto charts requires a keen eye for subtle shifts in market behavior. While many focus on obvious price swings, savvy traders delve deeper, seeking bullish patterns crypto markets often display. Look beyond simple trends to identify formations like bull flags, ascending triangles, and double bottoms. These can signal potential upward momentum, but don’t jump in blindly. Combine pattern analysis with volume indicators and market sentiment for a more robust strategy. Start by practicing on daily charts before tackling shorter timeframes.
Remember, even the most promising patterns can fail, so always set stop-losses. Regularly journal your observations to refine your pattern recognition skills over time. Stay adaptable – crypto markets evolve rapidly, and yesterday’s reliable pattern may be today’s false signal.
Pattern Recognition Tools and Resources
Effective cryptocurrency chart analysis relies on leveraging cutting-edge tools and curated resources. While mainstream platforms offer basic functionality, crypto-specific applications provide tailored insights for digital asset traders. Explore pattern recognition algorithms that can swiftly scan multiple timeframes, alerting you to emerging formations. Consider integrating sentiment analysis tools to gauge market mood alongside technical indicators. Customizable screeners allow you to filter assets based on your preferred metrics, streamlining your research process.
Don’t underestimate the value of educational resources – reputable online courses and webinars can significantly enhance your pattern recognition skills. As the crypto space evolves, stay adaptable and regularly reassess your toolkit to maintain a competitive edge.
Implementing Pattern Trading Strategies Effectively
To effectively implement pattern trading strategies in the market, focus on developing a personalized, data-driven approach.
Begin by meticulously documenting your pattern observations across various timeframes, noting both successful and failed formations.
Construct a robust risk management framework tailored to each pattern’s unique characteristics, adjusting position sizes accordingly.
Integrate momentum oscillators and volume analysis to validate pattern signals, but avoid over-relying on any single indicator.
Regularly reassess your strategy’s performance, using quantitative metrics to guide refinements. Consider the impact of market liquidity and volatility on pattern reliability, especially during significant news events.
Experiment with combining different patterns to create complex trigger conditions. Prioritize consistency in execution over seeking perfect setups.
As you gain experience, develop intuition for market rhythm, but always anchor decisions in concrete data and predefined rules.
FAQ
Do Chart Patterns Work Effectively in Crypto Trading?
Chart patterns are like weather forecasts for a turbulent climate – sometimes accurate, often unpredictable. Their effectiveness hinges on the trader’s ability to adapt to the digital asset ecosystem’s unique rhythms and sudden atmospheric shifts.
What Are the Best Chart Patterns for Crypto Trading?
The “best” patterns are as diverse as the coins themselves. Prosperous traders often craft their own hybrid formations, merging traditional patterns with crypto-specific indicators to capture the market’s digital DNA.
How to Interpret and Read Crypto Chart Patterns?
Reading chart patterns is akin to decoding a complex digital language. It requires not just technical skill, but a comprehension of the underlying blockchain narratives and global factors that shape this virtual landscape.
Start a Cryptocurrency exchange
Try our crypto exchange platform
Disclaimer: Please keep in mind that the content of this article is not financial or investing advice. The information provided is the author’s opinion only and should not be considered as direct recommendations for trading or investment. Any article reader or website visitor should consider multiple viewpoints and become familiar with all local regulations before cryptocurrency investment. We do not make any warranties about reliability and accuracy of this information.
Read more
In this article we will talk about Ripple (XRP) and its price prediction. What is Ripple (XRP) Ripple is a San Francisco-based startup that was launched in 2012 by Ripple Labs as a global network both for cross-currency and gross payments. Ripple history began in 2004 with the discussions around the digital coin in the […]
You may well think that an article dedicated to a Tether price prediction or the Tether price in general is a little bit strange — it is a stablecoin after all. However, the price of Tether does fluctuate significantly, although it is nowhere near as volatile as non-stablecoin cryptos. This means that staying up to […]
In the article we share our vision at Zcash cryptocurrency main features and add several price predictions. As cryptocurrencies gain global acceptance and decentralisation slowly enters our lives, privacy becomes the main concern when talking about blockchain adoption. It is no secret that distributed ledger is by far the most secure and transparent technology ever […]
Chiliz coin (CHZ) offers a compelling opportunity for traders interested in the intersection of blockchain technology and sports. By enabling fans to influence team decisions through the Socios app, Chiliz directly monetizes fan engagement and connects with major sports teams like Juventus and Paris Saint-Germain. These partnerships not only enhance the platform’s visibility but also […]
The exponential growth of Bitcoin Satoshi Vision (BSV) against the general bear trend on the cryptocurrency market in autumn 2019 has impressed the community. Due to the increasing market capitalization, the newly emerged altcoin was ranked 5th on CoinMarketCap and managed to maintain its high position at the beginning of 2020. In the article we […]
EOS is definitely on the list of the strongest and most stable projects in the crypto world. Despite the fact that the currency entered the market less than 3 years ago, it consistently occupies one of the top 10 places in the rating for project capitalization. it is often called the “main competitor of Ethereum”. […]