 Alex Tamm
Table of Contents
Chainlink trades near ~$8 (CoinGecko, refresh at publish) as of June 2026 , roughly 84% below its May 2021 all-time high of about $52.70. No one can guarantee where LINK goes next — credible 2026 forecasts span about $5 to $40, and 2030 estimates run from roughly $49 to $200. This article lays out bear, base, and bull scenarios for 2026–2030 as ranges, not guarantees. Not financial advice.
TL;DR — Chainlink Price Forecast at a Glance
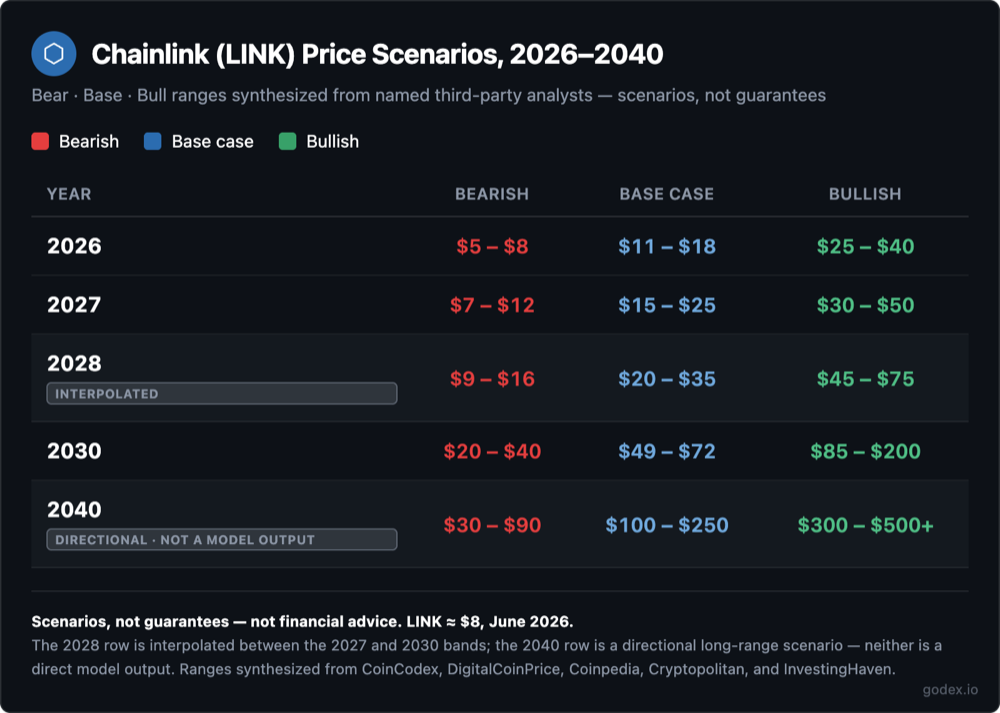
Three scenarios define LINK’s path through 2030. The bear case assumes the 2026 consolidation extends, with the Chainlink Labs supply unlock weighing on price. The base case assumes steady oracle and CCIP growth plus gradual RWA adoption. The bull case assumes tokenization scales, the Chainlink Reserve drives real buy-side demand, and a full market cycle lifts altcoins. Every figure below is a range from named third-party analysts — scenarios, not guarantees.
| Year | Bearish | Base case | Bullish |
|---|---|---|---|
| 2026 | $5 – $8 | $11 – $18 | $25 – $40 |
| 2027 | $7 – $12 | $15 – $25 | $30 – $50 |
| 2028* | $9 – $16 | $20 – $35 | $45 – $75 |
| 2030 | $20 – $40 | $49 – $72 | $85 – $200 |
| 2040** | $30 – $90 | $100 – $250 | $300 – $500+ |
*2028 is interpolated and **2040 is directional — not a model output. See note below.
Data as of June 2026, LINK ≈ $8 (CoinGecko) — scenarios, not guarantees, not financial advice. Ranges synthesized from CoinCodex, DigitalCoinPrice, Coinpedia, Cryptopolitan, and InvestingHaven; the Coinpedia top end sits near $200 for 2030. The 2028 row is interpolated between the 2027 and 2030 bands, and the 2040 row is a directional long-range scenario — neither is a direct model output.
What separates bull from bear: oracle market-share and Total Value Secured (TVS) growth, CCIP cross-chain adoption, real-world-asset (RWA) tokenization reaching scale (including the DTCC Collateral AppChain targeted for production in Q4 2026), staking demand, and Chainlink Reserve buy-side pressure on the bull side — against the Chainlink Labs supply unlock, competition, regulatory uncertainty, and macro conditions on the bear side.
Not financial advice. The predictions on this page are scenario ranges drawn from named third-party analysts and current market data. Cryptocurrency markets are volatile and past performance does not indicate future results. Do your own research. Nothing here is investment, legal, or tax advice.
Why Is Chainlink Down in 2026?
Chainlink is down because it sits roughly 84% below its May 2021 all-time high of about $52.70, trading near ~$8 (CoinGecko, refresh at publish) and consolidating off lower highs since December 2025. This is post-cycle behavior, not a collapse — support is watched near $6, resistance near $10.80–$11.
Three forces explain the drawdown. First, the broader altcoin market cooled after the 2021 cycle and has not produced a sustained LINK breakout since. Second, macro conditions and risk sentiment have kept speculative capital cautious. Third, supply overhang: about 730 million of LINK’s 1 billion maximum are circulating, which leaves roughly 270 million LINK still to enter circulation — a non-circulating Chainlink Labs allocation that is a recognized bear-case pressure on price. LINK’s network metrics have grown through this period; its token price has not tracked them. That gap is the core of the 2026 debate.
Chainlink Price and Performance: Where LINK Stands in June 2026
As of June 2026, LINK trades near ~$8 (CoinGecko, refresh at publish) with a market capitalization of roughly $5.9–6.4 billion , ranking around #17–19 by market cap. That places it about 84–85% below the May 2021 ATH of ~$52.70 (source: CoinGecko).
The recent trajectory is consolidation, not recovery. LINK has printed lower highs since December 2025 and trades in a band loosely bounded by $6 support and $10.80–$11 resistance, per June 2026 technical coverage (BanklessTimes flagged the $6 support level on June 4, 2026). For context only: this is the same asset that peaked near $52.70 five years ago — anyone modelling a return to those levels is modelling a full market cycle, not a near-term move. This section is current context; the scenarios come next.
What Drives Chainlink’s Price in 2026 and Beyond?
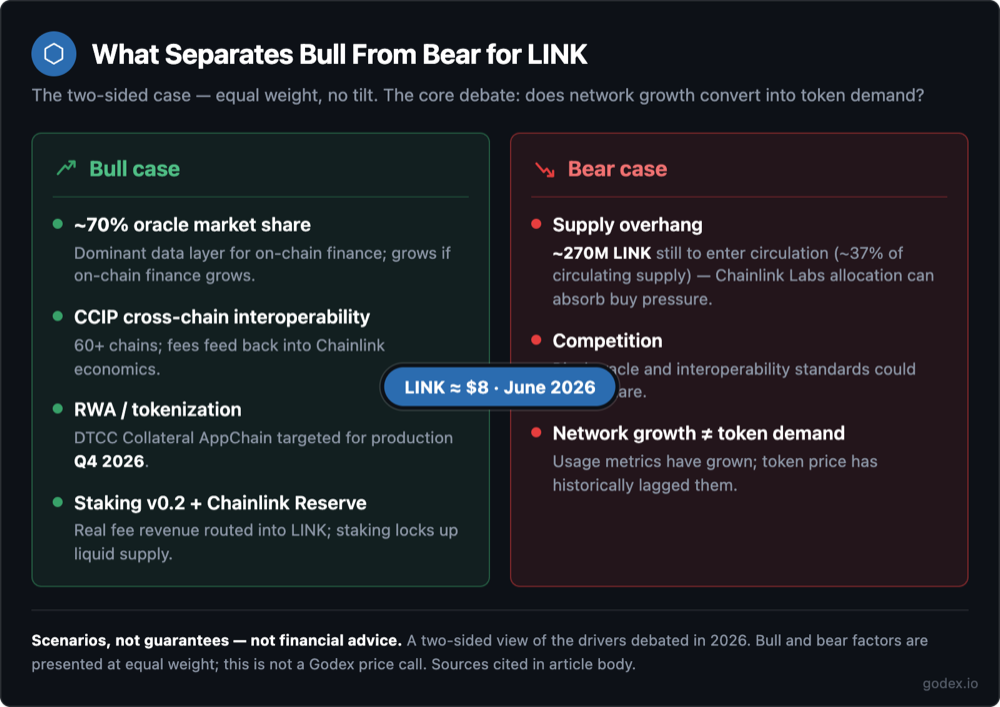
LINK’s price case rests on whether Chainlink’s network usage converts into token demand. Four drivers push that thesis; one major factor pushes back.
Oracle Market Dominance
Chainlink secures roughly 70% of the oracle market by value, with an estimated $75–93 billion in Total Value Secured (TVS — the dollar value of assets relying on Chainlink data) across 2,100+ integrated projects — about 40% year-over-year growth (source: Chainlink protocol data). An oracle feeds real-world data (like prices) into smart contracts — self-executing programs on a blockchain; without oracles, on-chain finance and tokenized assets cannot price or settle. This is the core bull thesis: if on-chain finance grows, the dominant oracle network grows with it.
CCIP and Cross-Chain
CCIP (the Cross-Chain Interoperability Protocol — the tech that moves data and crypto between blockchains) now supports 60–65+ blockchains, including non-EVM chains like Solana and Aptos, and secures about $33.6 billion in cross-chain tokens. Cross-chain transfer volume rose roughly 1,972% to $7.77 billion in 2025, and Coinbase selected CCIP as the exclusive bridge infrastructure for its chain. Interoperability is where multi-chain value movement concentrates — and CCIP fees feed back into Chainlink’s economics.
RWA, Tokenization, and Institutions
RWA tokenization means putting real-world assets — bonds, funds, collateral — onto a blockchain as digital tokens. Chainlink works with 24 major financial institutions and market infrastructures on this, but one concrete example beats a list of logos: the DTCC Collateral AppChain — DTCC clears and settles most US securities trades — is a Chainlink-based network for moving and tracking collateral between institutions in real time, and it is targeted for production in Q4 2026 (CoinDesk, May 2026). Others (Swift, Euroclear, UBS, and J.P. Morgan’s Kinexys, among others) are at various pilot and integration stages. This is adoption momentum, not a price guarantee — institutional pilots move slowly, and integration does not automatically translate into LINK demand.
Staking and the Chainlink Reserve (Economics 2.0)
Staking v0.2’s community pool is full at 40.875 million LINK (against a 45 million cap), paying a variable APY of about 4.32–4.75% (node operators around 7%). Under “Chainlink Reserve / Economics 2.0,” institutions can pay fees in USDC or ETH; the Reserve converts those fees to LINK on the back end, so the token captures network value, and staking rewards are increasingly funded by real CCIP and Data Streams fees rather than pure emissions. Staking also locks up liquid supply.
Supply and the Bear Case
About 730 million of LINK’s 1 billion maximum circulate today — which means roughly 270 million LINK (about 37% of current circulating supply) is still to enter circulation. That remaining Chainlink Labs allocation unlocking over time is the clearest bear-case overhang — new supply can absorb buy pressure. On regulation, SEC and CFTC moves in early 2026 leaned toward classifying LINK as a digital commodity , which would be constructive — but staff direction is not a final rule, and regulatory uncertainty remains a risk, not a resolved tailwind.
For the broader multi-coin picture beyond LINK, see our broader crypto market outlook for 2026–2027.
Chainlink Price Prediction 2026–2028: The Near Term
Near-term LINK forecasts span a wide bear-to-bull spread, and some models dip LINK back into single digits before any sustained recovery. Treat every figure as a range from a named source, not a target.
For 2026, bearish models from CoinCodex and DigitalCoinPrice cluster around $5–8 (extended consolidation), base-case estimates land near $11–18, and bullish cases reach $25–40. (One outlier — VirtualBacon’s ~$100 by 2026 — is an extreme call this article does not endorse; it sits far outside every other model.) For 2027, the base/bull spread widens to roughly $10–35, with some models still showing volatility back toward single digits. For 2028, interpolating the trajectory between 2027 and 2030 puts the range broadly in the $9–75 band across scenarios — directional, not precise. The honest read: the near term is dominated by whether the 2026 consolidation resolves up or down, and credible analysts disagree.
What Will Chainlink Be Worth in 2030?
By 2030, the common analyst average band sits around $49–72, with bullish cases ranging from $85 to $200 (Coinpedia’s top end is near $200) and bearish cases well below the average band. These are scenario ranges from named forecasters — not a consensus price.
What would have to compound to reach the upper band: RWA tokenization scaling from pilots to production volume (the DTCC AppChain is one early signal), CCIP becoming default cross-chain infrastructure, and the Chainlink Reserve converting enough real fee revenue into sustained LINK buy-side demand. The bear band assumes those drivers stall, supply unlocks keep weighing on price, or a competing oracle or interoperability standard gains ground. A decade is long enough for any of these to break either way.
Will Chainlink Reach $100?
$100 appears in some analysts’ long-range bull cases, but it is far above base-case estimates — and no credible model puts it on the near-term table. Coinpedia’s 2030 top end near $200 implies $100 is reachable on an aggressive path, while CoinCodex’s model is far more conservative — it does not project LINK reaching $100 within its horizon, topping out near $52 by 2047. Both poles are real; the honest answer is “possible on a sustained bull path, not predicted.”
For $100 to happen, several things would need to hold at once: continued oracle and TVS growth, RWA tokenization at real scale, durable staking and Reserve-driven demand, and a full favorable market cycle. Will LINK reach $50? That target sits nearer the old ATH (~$52.70) and is more plausible than $100 in a strong cycle — still a scenario, still not a guarantee. None of this is a prediction that either level will be hit.
Chainlink Price Prediction 2040: The Long View
Any 2040 figure is a directional scenario, not a model — a 14-year crypto forecast carries far more uncertainty than precision implies. Treat the 2040 row in the table above as illustrative of trajectory, not as a target.
On a path where Chainlink remains the dominant oracle layer for a tokenized financial system, long-range bull scenarios reach into the $300–500+ range, with base scenarios around $100–250 and bearish scenarios far lower. The high end is explicitly an aggressive scenario, attributed as such — not a consensus or a Godex projection. The further out the horizon, the more these numbers describe a story about adoption than a calculable price.
Is Chainlink a Good Investment in 2026?
Whether LINK is a good investment depends entirely on your risk tolerance and your read of the thesis — this article does not make that call for you. Here is the honest two-sided picture.
The bull side: Chainlink dominates the oracle market (~70% share, ~$75–93B TVS), CCIP is expanding across 60+ chains, RWA and institutional integrations (the DTCC Collateral AppChain among others) are advancing, and Economics 2.0 is designed to route real fee revenue back into LINK demand. The bear side: LINK is ~84% below its 2021 ATH, the Chainlink Labs supply unlock (~270M LINK still to enter circulation) is an ongoing overhang, oracle and interoperability competition is real, regulatory status is not finalized, and the token has historically lagged the network’s growth. This is a long-horizon scenario piece, not day-trading signals — and not a recommendation. See the disclaimer above and do your own research.
How to Swap Into or Out of Chainlink Without KYC
If you decide to move into or out of LINK, a non-custodial, no-KYC swap is the practical way to do it without opening an account or tying your identity to the trade. LINK is a commonly swapped asset, and a fixed-rate option lets you lock the rate for the duration of the swap rather than ride market movement while the transaction settles.
Godex.io is a non-custodial instant cryptocurrency exchange operating since 2017. It supports 936+ coins, requires no registration or KYC at any transaction size, and offers both fixed-rate and floating-rate swap modes. Processing time is 5–30 minutes after the deposit is received.
If you decide to act on either side of the trade, you can swap into or out of LINK without opening an account — you keep control of your funds throughout the swap.
Frequently Asked Questions
Why is Chainlink down in 2026?
LINK trades roughly 84% below its May 2021 all-time high of about $52.70. The drawdown reflects a post-2021-cycle cooldown, cautious macro sentiment, and the overhang from the remaining Chainlink Labs token supply (about 730 million of 1 billion circulate, leaving ~270 million still to enter circulation). As of June 2026, LINK is consolidating near ~$8 (CoinGecko), with support watched around $6 and resistance near $10.80–$11.
What will Chainlink be worth in 2030?
Named analyst forecasts cluster in a common average band of about $49–72 for 2030, with bullish cases ranging up to roughly $200 (Coinpedia’s top end) and bearish cases below the average band. These are scenario ranges, not a consensus price or a guarantee, and they depend on oracle, CCIP, RWA, and staking adoption playing out over the full horizon.
Will Chainlink reach $100?
It is possible in some long-range bull cases but far above base-case estimates. CoinCodex’s model is far more conservative — it does not project LINK reaching $100 within its horizon, topping out near $52 by 2047 — while Coinpedia’s 2030 top end near $200 implies $100 is reachable on an aggressive path. This is a scenario, not a prediction — and not a near-term forecast.
Is Chainlink a good investment in 2026?
That depends on your risk tolerance and your view of the thesis. The bull factors are oracle dominance, CCIP cross-chain growth, and RWA/institutional adoption; the risks are the Chainlink Labs supply unlock (~270M LINK still to come), competition, regulatory uncertainty, and volatility after an ~84% drawdown. This is general information, not financial advice — do your own research.
What was Chainlink’s all-time high?
Chainlink’s all-time high was about $52.70, reached in May 2021 (source: CoinGecko). As of June 2026, LINK trades roughly 83–85% below that level.
How do CCIP, RWA, and staking affect LINK’s price?
They drive real network fee revenue and demand. CCIP and Data Streams generate fees; under Economics 2.0, the Chainlink Reserve converts fees into LINK so the token captures network value; and staking locks up liquid supply (40.875 million LINK in the community pool). All are price-relevant, none is a guarantee.
Start a Cryptocurrency exchange
Try our crypto exchange platform
Disclaimer: Please keep in mind that the content of this article is not financial or investing advice. The information provided is the author’s opinion only and should not be considered as direct recommendations for trading or investment. Any article reader or website visitor should consider multiple viewpoints and become familiar with all local regulations before cryptocurrency investment. We do not make any warranties about reliability and accuracy of this information.
Read more
EOS is definitely on the list of the strongest and most stable projects in the crypto world. Despite the fact that the currency entered the market less than 3 years ago, it consistently occupies one of the top 10 places in the rating for project capitalization. it is often called the “main competitor of Ethereum”. […]
XRP price prediction 2026-2027: bear, base, and bull scenarios with ranges and named sources, the resolved SEC case, live spot ETFs, and can XRP reach $10?
In this article we will talk about Ripple (XRP) and its price prediction. What is Ripple (XRP) Ripple is a San Francisco-based startup that was launched in 2012 by Ripple Labs as a global network both for cross-currency and gross payments. Ripple history began in 2004 with the discussions around the digital coin in the […]
You may well think that an article dedicated to a Tether price prediction or the Tether price in general is a little bit strange — it is a stablecoin after all. However, the price of Tether does fluctuate significantly, although it is nowhere near as volatile as non-stablecoin cryptos. This means that staying up to […]
In the article we share our vision at Zcash cryptocurrency main features and add several price predictions. As cryptocurrencies gain global acceptance and decentralisation slowly enters our lives, privacy becomes the main concern when talking about blockchain adoption. It is no secret that distributed ledger is by far the most secure and transparent technology ever […]
Chiliz coin (CHZ) offers a compelling opportunity for traders interested in the intersection of blockchain technology and sports. By enabling fans to influence team decisions through the Socios app, Chiliz directly monetizes fan engagement and connects with major sports teams like Juventus and Paris Saint-Germain. These partnerships not only enhance the platform’s visibility but also […]