 Linda Larsen
Table of Contents
Understanding Profit and Loss (PnL) is vital for crypto investors and traders, even if numbers aren’t your forte. PnL reveals the real story behind your investments, showing gains or losses over time. It’s not just about crunching numbers; it’s about understanding your financial health and making informed decisions.
In the upcoming sections of this guide, we’ll delve into some key questions: What does PnL stand for? What does PnL mean in finance? And why is determining profits and losses crucial for sound business choices? But that’s not all. You’ll also unlock the secret to mastering common math formulas employed by seasoned investors. With handy tools and simplified approaches, you’ll find that crunching those numbers becomes a breeze, freeing up your mental bandwidth for smarter investment strategies.
What is Profit and Loss (PnL)?
So, what is PnL? PnL, short for Profit and Loss, stands as a fundamental financial measure used to assess the net earnings or losses of an individual or business within a specific timeframe. It essentially showcases the overall profit or loss generated, be it over a set period or across a series of transactions. This metric holds immense significance for investors, traders, and business proprietors alike. In trading realms, PnL meaning is straightforward: it denotes the profit or loss incurred from trades. It is calculated by subtracting the asset’s exit price from its entry price, factoring in any associated fees. PnL can further be categorized into Realized PnL and Unrealized PnL, each bearing unique implications in the trading landscape.
Realized PnL: Calculations and Examples
Realized Profit and Loss (P&L), or rPnL, is the profit or loss earned after closing a trading position. If the position is entirely closed, rPnL shows the final outcome. But if only part of the position is closed, it displays the profit or loss for that portion. This metric helps track investment effectiveness, evaluate trading strategies, and determine tax liabilities. The simple formula is:
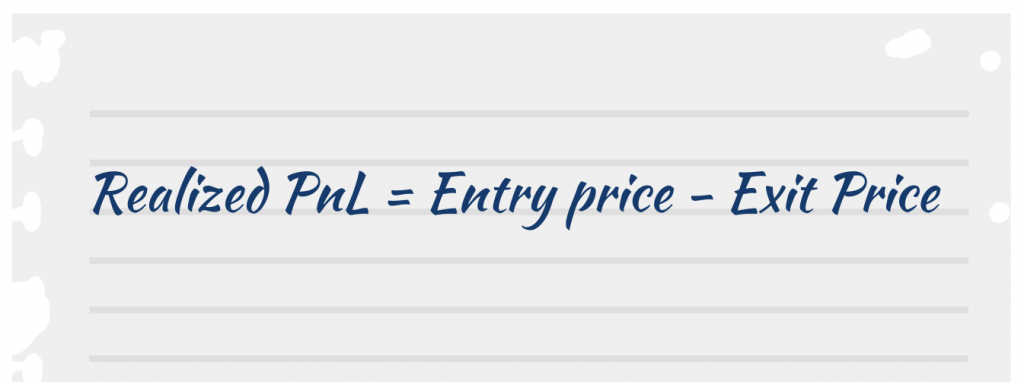
Let’s break down the concept further with an example: A trader buys 1 Bitcoin at $60,000, but the price drops to $30,000, resulting in a $20,000 loss. Instead of accepting the loss, the trader averages the position by buying another Bitcoin at $30,000. This lowers the average price to $45,000, as (1 * $60 000 + 1 * $30 000) / 2 = $45,000. If the Bitcoin price rises back to $60,000, the trader can realize some profit by closing part of the position.
For instance, selling half a Bitcoin (0.5 BTC) at $60,000 would yield a realized profit of $7,500 (($60,000 – $45,000) * 0.5). This example illustrates how averaging positions can turn losses into profits when the market rebounds.
Of course, the Bitcoin example above is now more of a visualization than a reality. Due to a record high of the first crypto that has topped the $72,850 level recently, all investors turned out to be in the black!
Unrealized PnL: Calculation and Application
Unrealized Profit and Loss (P&L) is like a window into potential gains or losses from an open trade. It’s the difference between the current market value and the entry price of your asset. However, these gains or losses impact your balance only when you close the position. The formula is the same as for realized PnL:

Suppose you buy Ripple (XRP) coins at an average entry price of $1.80 each. If the current market price drops to $0.8, your unrealized PnL would amount to -$1 per coin. This illustrates how closely tracking unrealized PnL can aid traders in optimizing their investment strategies and mitigating potential losses.
PnL Percentage: Significance and Calculation
PnL Percentage measures profit or loss relative to the initial investment, providing a way to gauge the performance of trading strategies. To calculate it, you need the starting value and final value of the investment. The formula is:
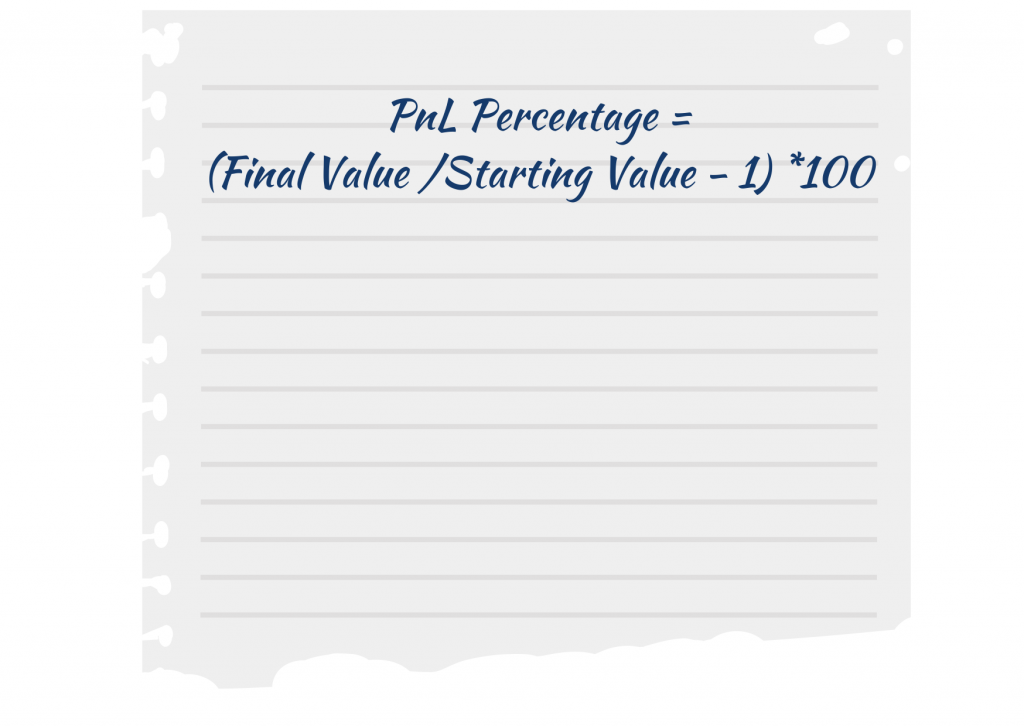
For instance, imagine a trader buys 1 Solana (SOL) for $50 and sells it for $150. The PnL percentage would be 200%.
However, it’s important to remember that these calculations are simplified and may not consider factors like taxes, trading fees, or market volatility.
PnL Ratio: Understanding and Application
PnL Ratio measures a trader’s performance by comparing total profits to total losses relative to their trading capital. To calculate it, divide total profits by total losses.
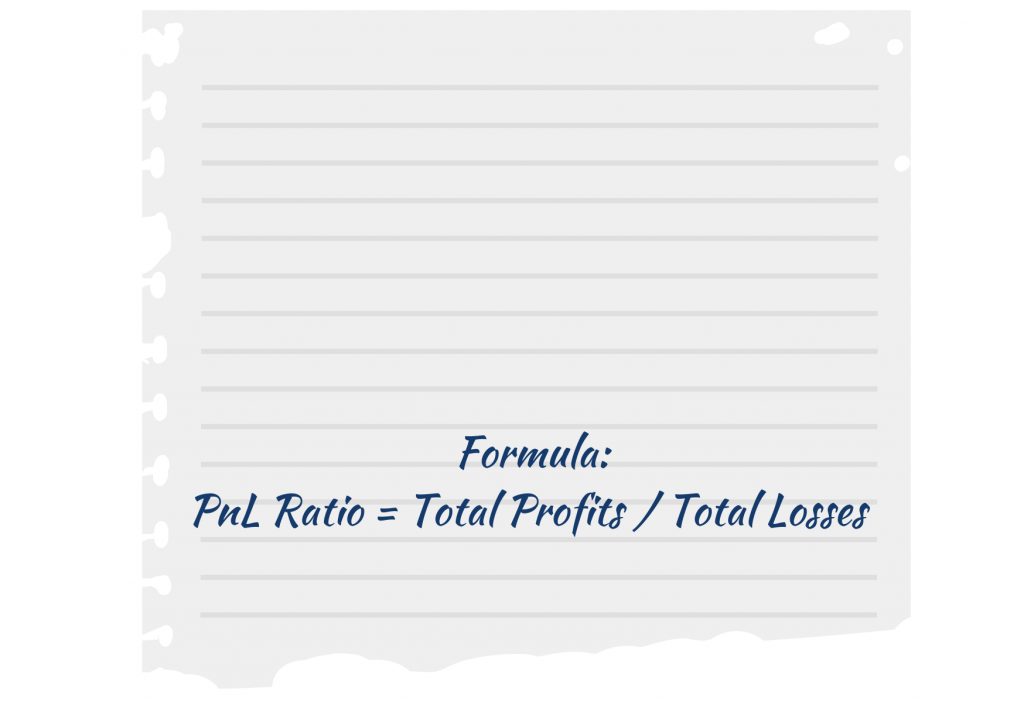
For example, if a trader earns $12,000 in profits and incurs $4,000 in losses, their PnL Ratio would be 3. A ratio greater than 1 signifies more profits than losses, indicating a successful trading strategy.
How to Calculate PnL: Methods and Tools
The PnL metrics can be expressed in various formats, including percentages and currency values, providing a clear picture of investment outcomes. Let’s explore the primary methods for profit and loss calculation, supplemented by practical examples.
PnL Calculation Formula
The general formula for calculating PnL in the cryptocurrency domain is similar to traditional financial markets:
PnL = (Exit Price×Number of Sold Units)−(Entry Price×Number of Bought Units)−Fees
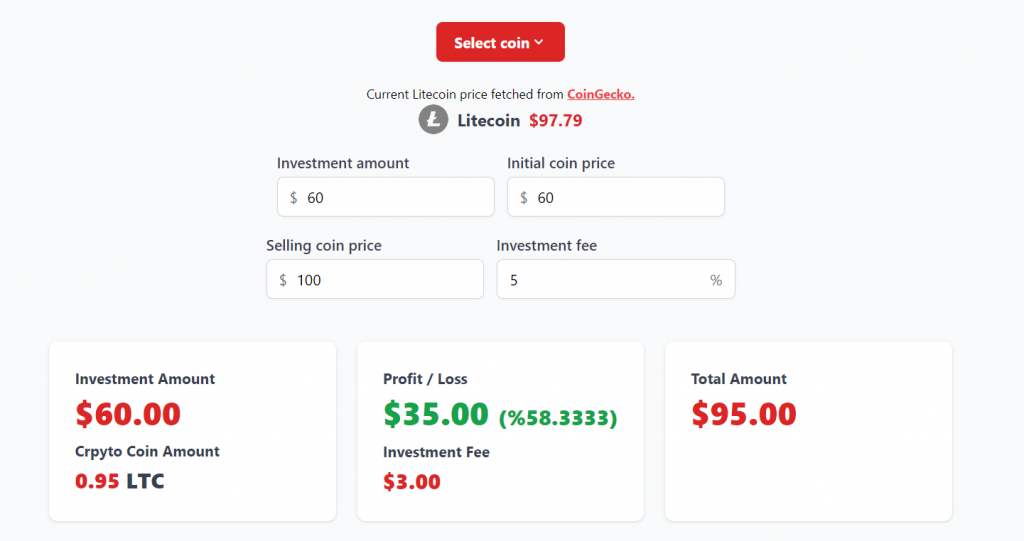
For instance, consider a scenario where an investor sold 1 unit of Litecoin (LTC) for $100 after purchasing it for $60, with a $5 transaction fee. The PnL calculation would be:
($100×1LTC)−($60×1LTC)−$5 = $35
Thus, the PnL for this transaction is $35. Tools like the crypto profit calculator facilitate the PnL calculation by considering trading position, asset price, amount, and transaction fees, offering results in both currency values (e.g., Tether USDT) and percentages.
Source: mortgagecalculator
- First-in, First-out (FIFO) Method
The FIFO method dictates that the cost of the oldest purchased assets be used first in the PnL calculation. This approach is commonly used for tax purposes in many jurisdictions.
Example:
Suppose you purchase 1 unit of Ethereum (ETH) at $3,700 and later buy another unit at $3,500. When you sell 1 unit at $3,900 a year later, the FIFO method uses the $3,700 as the initial price for PnL calculation:
Initial cost: 1 ETH x $3,700 = $3,700
Sale price: 1 ETH x $3,900 = $3,900
PnL: $3,900 – $3,700 = $200 profit
- Last-in, First-out (LIFO) Method
The LIFO method uses the cost of the most recently purchased assets for the PnL calculation, providing an alternative approach to asset valuation.
Example:
Using the same scenario as above but applying the LIFO method:
Initial cost: 1 ETH x $3500 = $3500
Sale price: 1 ETH x $3,900 = $3,900
PnL: $3,900 – $3500 = $400 profit
- Weighted Average Cost Method
This method calculates the PnL based on the average cost of all units of a digital currency in the portfolio, providing a balanced view of investment performance.
Example:
Suppose you buy 1 unit of Ethereum (ETH) at $3,500 and another at $3,700. Then, you sell 1 unit at $3,900, using the weighted average cost method for PnL:
Total cost: (1 ETH x $3,500) + (1 ETH x $3,700) = $7,200
Weighted average cost per unit: $3,500 / 2ETH = $1,750
Sale price: 1 ETH x $3,900 = $3,900
PnL: $3,900 – $1,750 = $2150 profit
Each method offers distinct advantages and can be chosen based on individual investment strategies, tax considerations, or personal preference. Beyond calculating profit and loss, traders have access to resources such as custom spreadsheets and automated trading algorithms, which assist in evaluating their trading outcomes and identifying lucrative opportunities, suitable for both novice and experienced traders alike. Using the right tools and methods for PnL calculation can significantly enhance decision-making and performance analysis in crypto investing.
Profits and Losses from Opening and Closing Positions
Navigating through the realms of crypto trading involves a deep comprehension of opening and closing positions. It is critical for strategizing profits and mitigating losses. Once a trader initiates a purchase, they’re said to have opened a position, marking the beginning of an investment journey with a specific asset. Closing a position, conversely, occurs when this asset is sold, ideally at a profit.
Closing the position crystallizes the financial outcome, turning unrealized gains or losses into realized ones. For example, buying ETH at $2,000 and selling at $2,500 would result in a $500 profit per unit. This process of analyzing and managing open and closed positions allows traders to systematically assess their trading performance, strategize future moves, and adapt to market fluctuations. It embodies the essence of trading cycles in the volatile crypto market, where disciplined analysis and decision-making pave the way for potential financial gains.
Year-to-Date (YTD) Calculation: Assessing Long-Term Performance
The Year-to-Date (YTD) metric serves as an invaluable tool for gauging the performance of crypto investments from the beginning of the calendar year up to the present moment. It offers long-term investors an insight into the potential gains or losses on their holdings, without the need to liquidate their assets. To perform a YTD calculation, one simply assesses the portfolio’s worth at the start and at a subsequent point within the same year, whether this aligns with the calendar or fiscal year may vary based on individual preferences or specific financial strategies. For example, if an investor’s portfolio of Solana (SOL) was valued at $10 on January 1st and then increased to $150 by the end of the year, the unrealized profit would be $140. This figure represents the gain on investment that has not yet been realized through sale or other forms of conversion into cash assets.
Using PnL Statements Effectively
A PnL statement, or income statement, is a financial snapshot capturing a trader’s earned versus spent money over a specific period. It comprises several key components:
- Revenue: The total income from selling cryptocurrencies.
- Cost of Goods Sold (COGS): The direct expenses tied to producing or purchasing your crypto assets.
- Gross Profit: What remains after subtracting COGS from revenue, highlighting the efficiency of your trading strategy.
- Operating Expenses: The day-to-day costs of running your crypto trading activities.
- Operating Profit: Your earnings before interest and taxes, revealing your operational success.
- Net Profit: The bottom line that tells if you’re in the green or red, after all, is said and done.
To wield PnL statements effectively in the crypto world, consider them your financial dashboard. They’re not just about numbers but stories telling you where you’ve been profitable and where you might need to cut back or adjust strategies.
- Goal Setting: Use them to set financial targets, like boosting your trading volume or reducing fees.
- Performance Monitoring: Regularly analyze your PnL to gauge your trading strategy’s effectiveness.
- Trend Analysis: Look for patterns over time. Are there certain times of the year where you perform better?
- Benchmarking: Compare your results with industry standards or peers to spot areas for improvement.
- Professional Consultation: Sometimes, a second pair of eyes, especially from a financial expert, can offer new insights or confirm your strategy’s direction.
In essence, PnL statements are not just financial records but strategic tools that, when correctly interpreted, can illuminate the path to achieving long-term trading success.
Conclusion: Mastering PnL for Financial Success
Understanding “what is PnL in trading?” serves as a crucial step for any trader seeking financial success. It transcends mere profit and loss tracking, acting as a strategic guide for every market move. By mastering PnL, traders can refine their approaches, reduce risks, and boost their gains. This expertise empowers them to confidently traverse the complexities of trading, converting insights into actions for enduring achievement. Embracing the essence of PnL marks the beginning of a trader’s journey towards financial mastery.
FAQ
What is the Significance of PnL in Trading and Investments?
The significance of PnL in trading and investments cannot be overstated, as it directly impacts a trader or investor’s financial health and strategy. By comprehending the PnL meaning, finance managing and trading activities become more strategic and prosperous. This metric is crucial because it provides a clear picture of financial performance, enabling traders and investors to evaluate how well their strategies are working in real-time. It’s not just about the numbers; understanding PnL influences decision-making, risk management, and future strategy adjustments. Essentially, it’s the scoreboard of the financial world, where keeping track can mean the difference between growing your portfolio and watching it stagnate.
What Methods and Tools Are Utilized for Accurate PnL Calculations?
For precise PnL calculations, traders now lean on advanced methods and tools, a leap from the traditional trader’s diary once recommended by seasoned traders for spotting patterns. The essence of timely and comprehensive analysis hasn’t changed, but the tools have evolved. For accurate PnL calculations, traders use a mix of methods like FIFO (First In, First Out) and LIFO (Last In, First Out), along with weighted average cost. Tools range from specialized trading software to simple spreadsheets. These methods and new technologies help in tracking the cost basis, sales proceeds, and fees to pinpoint profits or losses. Essentially, they turn raw data into actionable financial insights, vital for making informed trading decisions.
How Can PnL Statements Be Effectively Used in Financial Decision-Making?
PnL statements are pivotal in shaping financial decisions. They serve as a financial snapshot, revealing the profits and losses over a specific period. By analyzing these statements, investors can identify which strategies yield success and which don’t, allowing for strategic adjustments. Effectively using PnL statements helps in pinpointing areas of strength and weakness, guiding decisions towards optimizing returns and mitigating risks, making them a fundamental tool in savvy financial planning and decision-making.
Start a Cryptocurrency exchange
Try our crypto exchange platform
Disclaimer: Please keep in mind that the content of this article is not financial or investing advice. The information provided is the author’s opinion only and should not be considered as direct recommendations for trading or investment. Any article reader or website visitor should consider multiple viewpoints and become familiar with all local regulations before cryptocurrency investment. We do not make any warranties about reliability and accuracy of this information.
Read more
EOS is definitely on the list of the strongest and most stable projects in the crypto world. Despite the fact that the currency entered the market less than 3 years ago, it consistently occupies one of the top 10 places in the rating for project capitalization. it is often called the “main competitor of Ethereum”. […]
XRP price prediction 2026-2027: bear, base, and bull scenarios with ranges and named sources, the resolved SEC case, live spot ETFs, and can XRP reach $10?
In this article we will talk about Ripple (XRP) and its price prediction. What is Ripple (XRP) Ripple is a San Francisco-based startup that was launched in 2012 by Ripple Labs as a global network both for cross-currency and gross payments. Ripple history began in 2004 with the discussions around the digital coin in the […]
You may well think that an article dedicated to a Tether price prediction or the Tether price in general is a little bit strange — it is a stablecoin after all. However, the price of Tether does fluctuate significantly, although it is nowhere near as volatile as non-stablecoin cryptos. This means that staying up to […]
In the article we share our vision at Zcash cryptocurrency main features and add several price predictions. As cryptocurrencies gain global acceptance and decentralisation slowly enters our lives, privacy becomes the main concern when talking about blockchain adoption. It is no secret that distributed ledger is by far the most secure and transparent technology ever […]
Chiliz coin (CHZ) offers a compelling opportunity for traders interested in the intersection of blockchain technology and sports. By enabling fans to influence team decisions through the Socios app, Chiliz directly monetizes fan engagement and connects with major sports teams like Juventus and Paris Saint-Germain. These partnerships not only enhance the platform’s visibility but also […]