 Linda Larsen
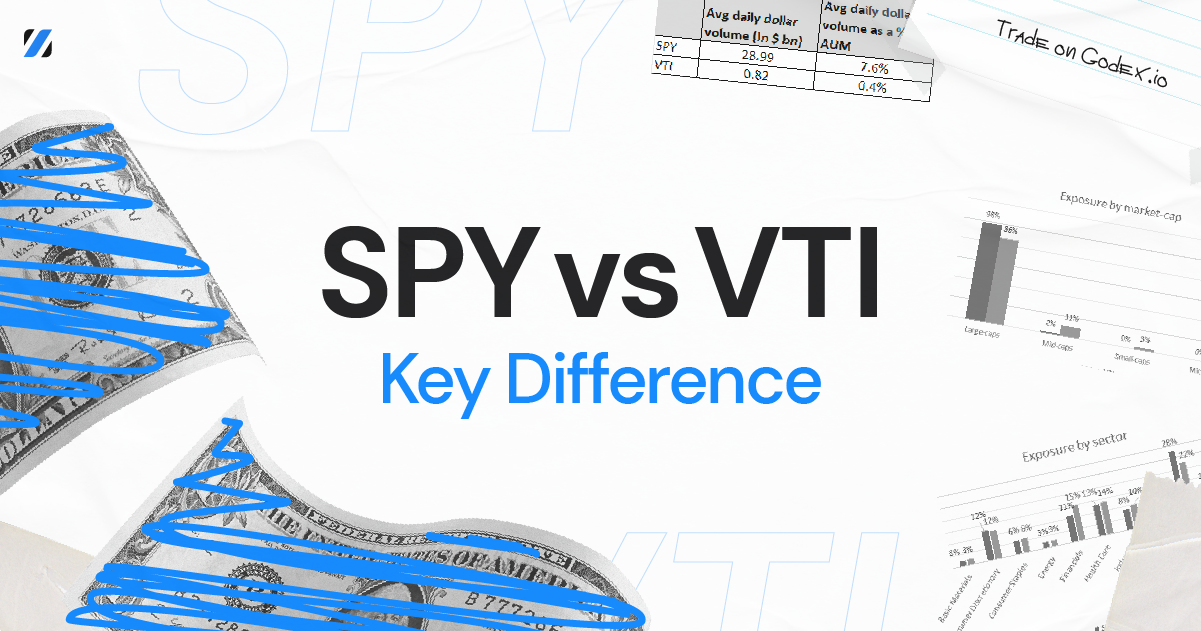
Table of Contents
SPY Overview
The well-known S&P 500 SPDR (Standard & Poor’s Depositary Receipts) fund (SPY) is one of the oldest ETFs in the USA, following the S&P 500 index. It was launched on 22 January 1993 by the State Street Global Advisors (SSGA was founded in 1978). SSGA is an asset management company based in Boston, Massachusetts.
SPY expense ratio is 0.09%. An expense ratio is the percentage of a fund’s assets that are used for administrative expenses. Essentially, it is the fee you pay to buy a professionally managed product. Thus, a person who invests $100,000 in SPY ETF shall pay $90 in management fees.
ETF SPDR S&P 500 securities are freely traded on the NYSE Arca electronic exchange under the ticker SPY. The fund is known informally as “Spiders”.
SPY is the world’s best-selling ETF with an average trading volume of 80 million shares per trading session. The fund distributes dividends every quarter. Dividend yields are around 2%, but there are companies where this figure reaches as high as 5%-11%. In terms of economic sectors, the most profitable stocks are those of energy companies and real estate investors.
Key SPY ETF sectors are the following:
- Information technology (24.19%);
- Financial services (13.55%);
- Telecom services (11.18%);
- Industry (9.04%);
- Consumer protection (7.17%);
- Consumer cycles (10.99%);
- Real estate (2.52%);
- Healthcare (13.82%);
- Utilities (2.86%).
To enter the S&P 500 list, a company has to meet the following requirements:
- a minimum trading volume of at least 250,000 shares per month;
- and a market capitalization of at least $5 million.
However, these criteria are subject to revision.
It is often used as a benchmark to compare performance when building your investment portfolio. It is also used by traders to switch between active and passive trading. The fund is preferable for long-term investments and includes large-cap U.S. equities from the S&P500 index (includes shares in Miсrosoft (MSFT) 5.36%, Apple, Twitter, General Motors, Nike, eBay, Boeing, and other major U.S. companies.
VTI Overview
The Vanguard Total Stock Market ETF (VTI) tracks the performance of the CRSP US Total Market Index. Since its inception in 2001, the fund has had an annual return of 7.12%. Keep in mind that this doesn’t necessarily mean you’ll get up to an 8% return every year. In some years you will make unprecedented profits, while in other years you will see losses. However, over time, that return can average around 8% per year.
The Vanguard Total Stock Market ETF is an open-end fund issued by Vanguard and recommended by Vanguard Equity Investment Group. This fund is a passive index fund, so its expense ratio is 0.03%. The fund has a very low turnover rate of 4.1%, which means limited transaction costs to change fund holdings. The expense ratio does not include fees or brokerage charges. The low expense ratio is beneficial for long-term fund investors.
The Vanguard Total Stock Market ETF offers broad access to the U.S. equity market, investing in thousands of different securities across all sectors. This makes VTI an attractive option for investors looking to simplify their portfolios and minimize rebalancing obligations.
VTI has the potential to be a useful tool for quickly identifying risky assets. This ETF is one of the most affordable in terms of price, and the ability to trade commission-free in a Vanguard account further enhances the appeal for frugal investors.
Microsoft (MSFT) is the largest holding with a 4.8% stake, followed by Apple (AAPL) with a 4.1% stake, Amazon.com (AMZN) is the third-largest holding with a share of 3.7% and Alphabet (GOOG) is the fourth with a share of 2.8%.
Key sectors of the VTI ETF are the following:
- Technology (24.7%);
- Financials (16.9%);
- Health care (14.8%);
- Consumer Goods (13.11%);
- Energy (3.29%);
- Basic materials (2.57%);
- Utilities (3.18%).
Differences between SPY and VTI
VTI
- Fund Inception: 2001;
- Tracks the CRSP US Total Market Index;
- Expense Ratio: 0.03%;
- Net assets 840.92B;
- Vanguard ETF;
- No Minimum Investment;
- Number Of Stocks: more than 3900.
SPY
- Fund Inception: 1993;
- Tracks the S&P 500 Index;
- Expense Ratio: 0.09%;
- Net assets 262.09B;
- State Street Fund;
- Number Of Stocks: more than 500.
Let’s look at the following factors to focus on SPY VTI comparing.
VTI net assets are about three times larger. In some scenarios, a fund’s net assets can become a defining moment in terms of trading opportunities.
VTI has an expense ratio of 0.03% while SPY, by contrast, provides 0.09%. Although even 0.09% is still relatively weak, this expendable differential could increase over time.
VTI traces the whole U.S. stock market, including small- and small-cap stocks. However, the proportion of these companies with low market capitalization versus mid-and large-cap stocks is quite small.
SPY monitors the S&P 500 index, which includes more than 500 of the biggest companies in the USA. In the aftermath, small-cap companies are not incorporated in the fund and large-cap stocks account for about 90% of net assets. Mid-cap stocks account for about 10% of assets.
With a monthly cost fluctuation of 4.16% and an annual price variation of 14.41%, VTI is somewhat more volatile than SPY. Although the SPY uppermost drawdown is – 50.80%, the one of VTI is also marginally higher because VTI contains a variety of low-cap enterprises, which tend to either skyrocket rapidly or go bankrupt easier and more frequently than large-cap companies.
Similarities between SPY and VTI
When considering some of the SPY versus VTI key financial metrics, it is not surprising that both ETFs show very related figures, and have net assets beyond $100 billion. The ability to trade would not be a problem for a common investor in both funds.
VTI contains all of the SPY shares, so in effect, SPY is inside it. VTI currently has a yield of 1.93% and SPY has a yield of 1.9%. With the view of returns, both ETFs will perform fairly along similar lines.
Together SPY and VTI have almost similar sector allocation, (although their percentages differ slightly). The only factual difference is that SPY includes a larger number of technology companies. Apple Inc, Microsoft Corp, Amazon Inc, Alphabet Inc, and Tesla are the most represented companies in the mentioned ETFs.
The two funds are incredibly popular with long-term investors.
Finally, SPY and VTI are exchange-traded funds, therefore they trade intraday until the markets close.
Conclusion
Both ETFs have similar investment objectives and target a homogenous group of investors. The goal of any investor considering VTI or SPY should be a long-term, well-diversified strategy.
Long-run investing in the stock market is usually the best option for both “new” and experienced prudent investors. However, investing in the stock market “manually” (i.e. individually selecting the companies that make up a portfolio) is a titanic task that is beyond the reach of mere mortals.
This is where ETFs and their diversification come in: why look for the companies to invest in when you can invest in all companies, diversifying, reducing risk, and saving a lot of time?
ETFs make it easier for new and small investors to access a diversified tool that can easily and safely replicate any index. Thanks to them, and without having to invest a lot of time and effort, investors can get the benefits of capital markets, which outperform managed funds by 97% of the time.
If you’re still in doubt, ETFs are ideal tools for smaller investors and people just entering the investment world. They are very easy to comprehend, statistically, they can give you more benefits than almost any other tool, they have moderate risk and allow you to learn about concepts such as diversification, risk, returns, indices or stocks, etc.
Read also Theta Price Prediction for 2022-2027, 2030
FAQ
Is VTI the same as SPY?
VTI and SPY are the most popular ETF index funds that have many of the same underlying assets.
Both ETFs are traded in U.S. markets.
VTI and SPY are great investments depending on your investment objectives. They both have a history of outstanding returns and are low-cost ETFs.
Is SPY better than VTI?
Working with SPDR S&P 500 ETF is a profitable investment that has good prospects with a prudent investment approach.
Buying the fund’s securities is a good defense, as the U.S. market is followed by all others and recovers fairly quickly even in times of crisis.
Here are a few key reasons to become a shareholder in the SPDR S&P 500 ETF:
- High level of diversification across sectors and industry groups;
- Very low gross expense ratio;
- Passive management;
- Dividends;
- High liquidity.
The benefits of VTI are the following:
- Vanguard Brokerage (an investor-owned company)
- Lower expense ratio;
- Greater diversification (more holdings).
They both have super-low expense ratios (0.03% vs 0.09%). Either SPY or VTI is therefore an excellent investment to achieve financial independence.
Is SPY safe as VTI?
VTI is a fund that contains 3,900 stocks of the small, medium, and large companies from a wide range of sectors. It aims to replicate the performance of the stock market as a whole, making it a relatively safe investment. The stock market itself does experience short-term volatility, but in the long run, it generates positive returns.
SPY is an ETF fund that is designed to allow you to buy or sell the S&P 500 index. The fund’s portfolio is constructed and balanced in such a way that its dynamics almost exactly mirror those of the S&P 500 index. This is very convenient if you don’t want to be a stock picker, but you have a general idea of how the market is going to develop. To do so, you simply open a short or long position in shares of SPY.
The SPDR S&P 500 ETF is currently the most popular ETF on the U.S. stock market. It is managed by State Street Global Advisors. The popularity of the fund provides it with high liquidity.
In general, the risk of misuse of ETFs is low. The Securities Exchange Commission in the USA scrutinizes any applications for ETFs, and only large and transparent companies can afford to create and redeem ETFs. Finally, another federal agency, the Depository Trust Clearing Corporation, verifies that individual share certificates are in the hands of the correct holders after trading. It also verifies ETF certificates resulting from ETF trading. In decades of trading ETFs worth billions of U.S. dollars, there has never been a single case of losing money as a result of ETF fraud.
The risk of an inappropriate asset is a different thing. Each asset class has to be tested separately, and asset compliance risk can change over time. It is clear that equities are risky, and technology or emerging market equities in particular. Long-term bonds or real estate are also risky. However, short-term investment bonds are considered perfectly safe.
Start a Cryptocurrency exchange
Try our crypto exchange platform
Disclaimer: Please keep in mind that the content of this article is not financial or investing advice. The information provided is the author’s opinion only and should not be considered as direct recommendations for trading or investment. Any article reader or website visitor should consider multiple viewpoints and become familiar with all local regulations before cryptocurrency investment. We do not make any warranties about reliability and accuracy of this information.
Read more
EOS is definitely on the list of the strongest and most stable projects in the crypto world. Despite the fact that the currency entered the market less than 3 years ago, it consistently occupies one of the top 10 places in the rating for project capitalization. it is often called the “main competitor of Ethereum”. […]
XRP price prediction 2026-2027: bear, base, and bull scenarios with ranges and named sources, the resolved SEC case, live spot ETFs, and can XRP reach $10?
In this article we will talk about Ripple (XRP) and its price prediction. What is Ripple (XRP) Ripple is a San Francisco-based startup that was launched in 2012 by Ripple Labs as a global network both for cross-currency and gross payments. Ripple history began in 2004 with the discussions around the digital coin in the […]
You may well think that an article dedicated to a Tether price prediction or the Tether price in general is a little bit strange — it is a stablecoin after all. However, the price of Tether does fluctuate significantly, although it is nowhere near as volatile as non-stablecoin cryptos. This means that staying up to […]
In the article we share our vision at Zcash cryptocurrency main features and add several price predictions. As cryptocurrencies gain global acceptance and decentralisation slowly enters our lives, privacy becomes the main concern when talking about blockchain adoption. It is no secret that distributed ledger is by far the most secure and transparent technology ever […]
Chiliz coin (CHZ) offers a compelling opportunity for traders interested in the intersection of blockchain technology and sports. By enabling fans to influence team decisions through the Socios app, Chiliz directly monetizes fan engagement and connects with major sports teams like Juventus and Paris Saint-Germain. These partnerships not only enhance the platform’s visibility but also […]