 Alex Tamm
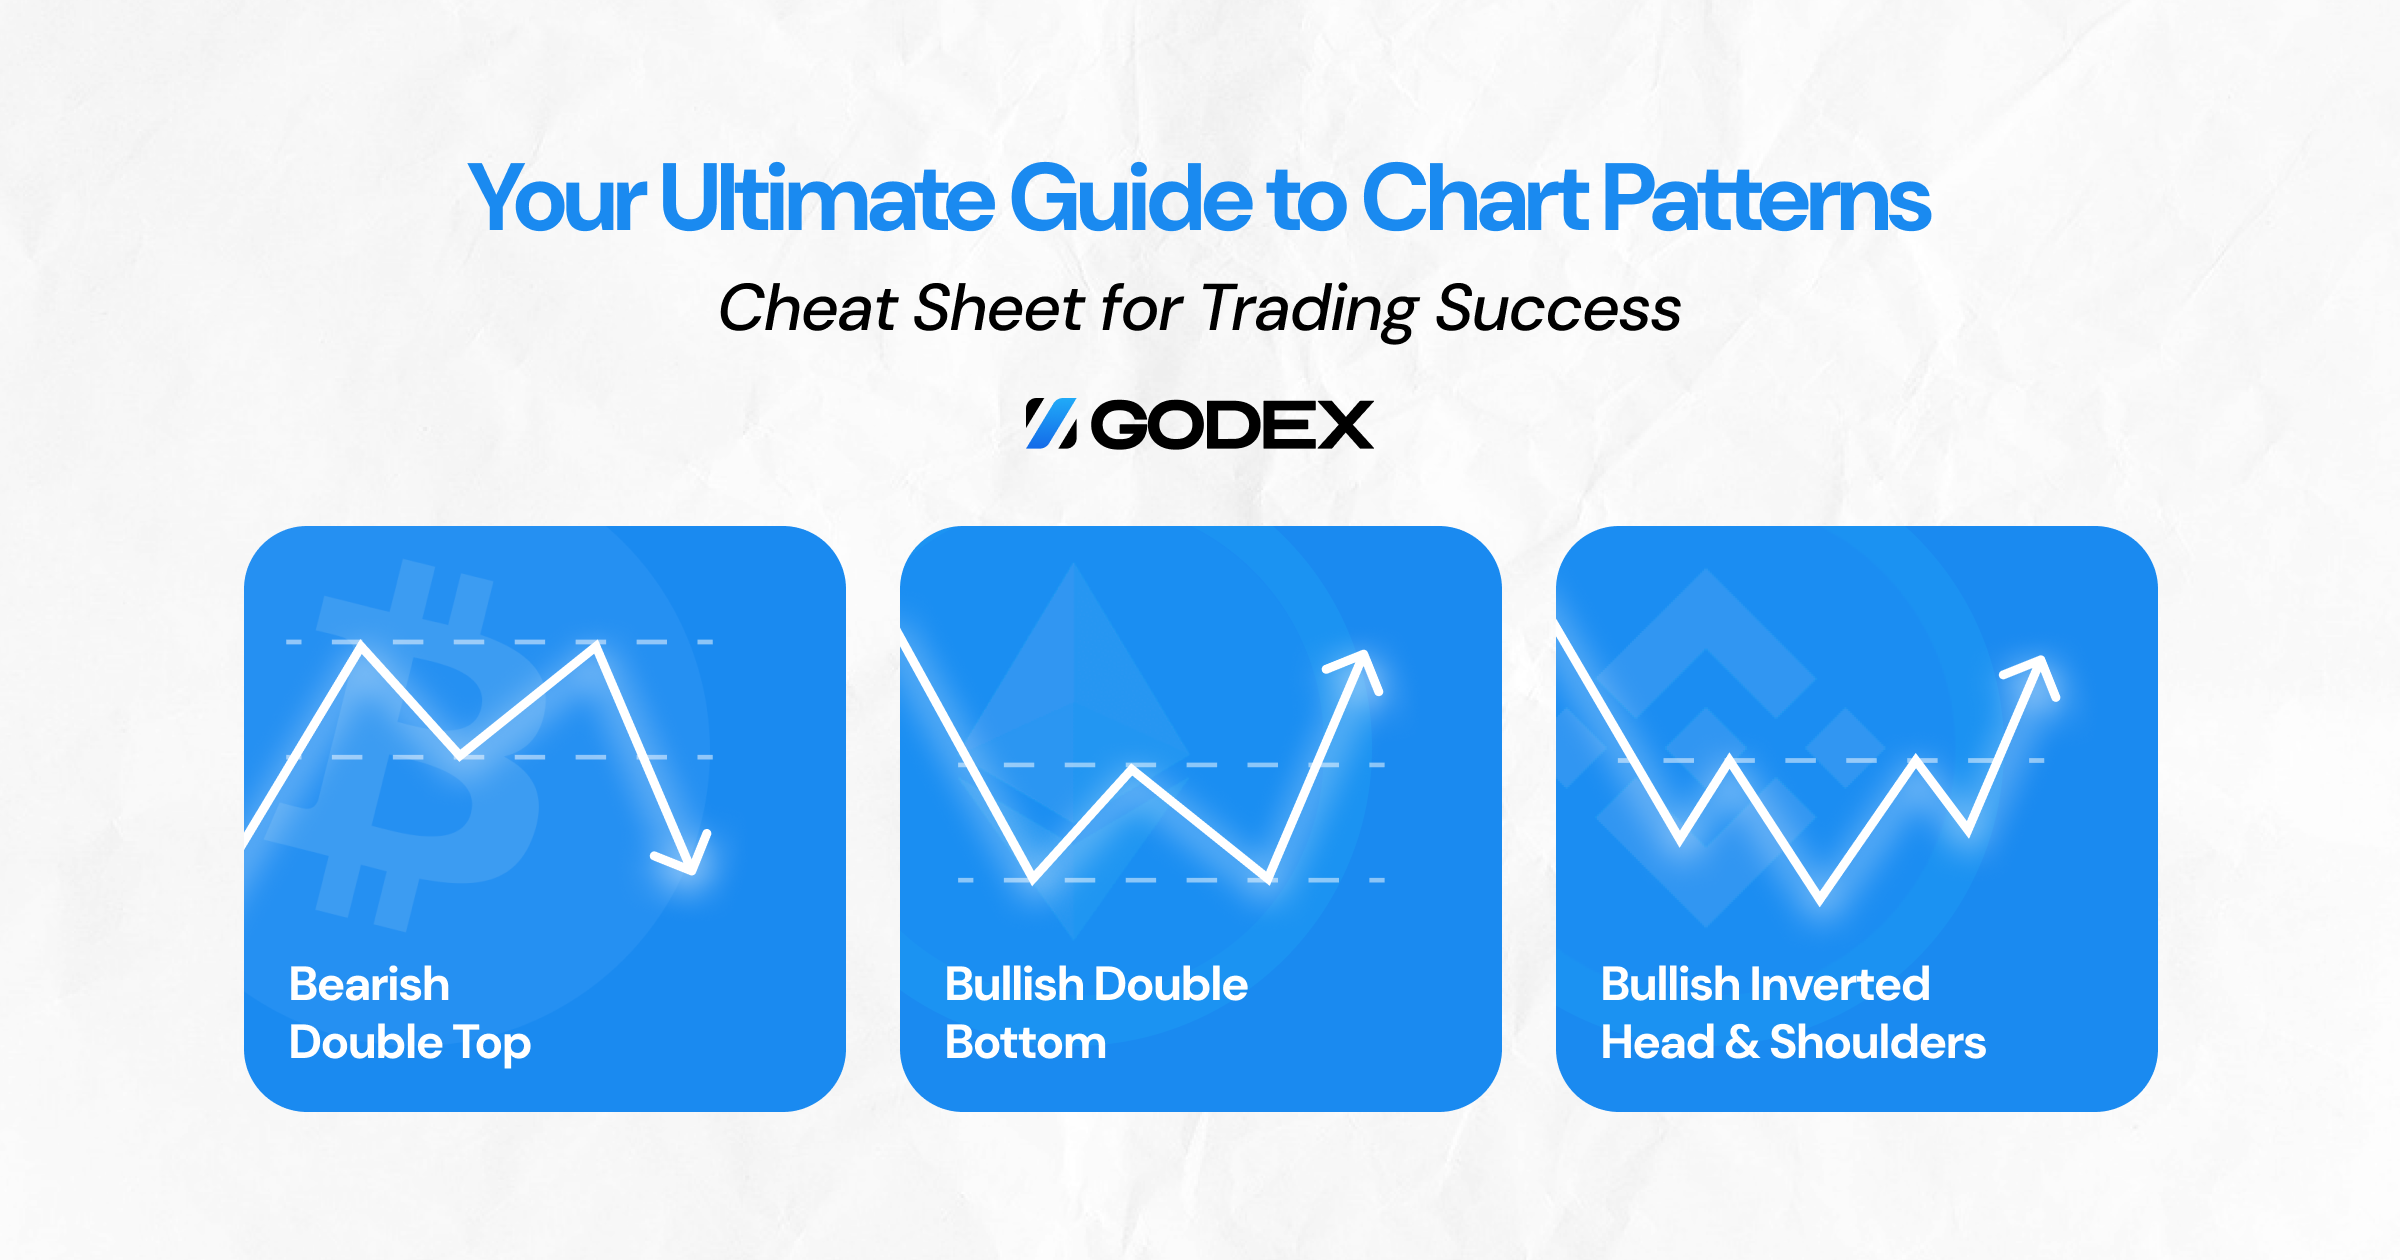
Table of Contents
Ever felt like the market is speaking a language you can’t quite understand? You’re not alone.
Chart patterns are the market’s way of telling a story – about fear, greed, momentum, and opportunity. Master these visual cues and you’ll gain an edge that most traders spend years chasing. This trading patterns cheat sheet is your decoder ring for market movements, turning complex price action into clear, actionable signals.
Ready to transform random price movements into predictable profit opportunities? Let’s crack the code together.
What is a Chart Pattern Cheat Sheet and How Does it work?
A chart pattern cheat sheet is your quick-reference guide to the financial markets’ visual language. It’s simple: key patterns on one page for fast decisions.
What’s included? You’ll find pattern names, clear visuals, and specific trading criteria. Most importantly, you get exact entry points, exit targets, and stop-loss levels for each formation.
These tools work by organizing patterns into logical groups. Reversal patterns signal trend changes. Continuation patterns confirm existing momentum. This system is designed to streamline access to what matters most during live trading.
The real value comes from saved time. No more analyzing each pattern from scratch. Notice a formation? Glance at your cheat sheet and act accordingly.
The Importance of Using a Chart Pattern Cheat Sheet
Chart pattern cheat sheets eliminate guesswork from trading decisions. They compress years of technical expertise into instant reference points, helping you identify high-probability setups within seconds.
For beginners, they flatten the learning curve dramatically. For experienced traders, they enforce consistency during emotional market conditions. In time-sensitive situations, this quick-access format transforms vague observations into precise entry and exit coordinates—often making the difference between profit and loss.
Different Types of Chart Pattern Cheat Sheets
Chart pattern reference tools come in various forms. Each serves a specific trading need. Here’s what you need to know.
By Pattern Function
Most trading patterns cheat sheets organize formations by what they predict. Continuation sheets show patterns that signal “more of the same.” Reversal collections highlight formations indicating “change is coming.” Bilateral references feature patterns that could break either way.
By Trading Style
Speed matters. The day trading patterns cheat sheet highlights quick-forming patterns visible on 5-minute charts. In swing trading, the focus is on formations that take days to develop. Position traders rely on guides that emphasize long-term patterns found in monthly charts.
By Market Type
Markets have personalities. A forex chart patterns cheat sheet emphasizes currency-specific formations like the three-drive pattern. The stock patterns cheat sheet includes volume-based signals critical for equity traders.
By Experience Level
Beginner chart cheat sheets feature the classic eight patterns with simple explanations. Advanced technical analysis patterns cheat sheet collections include rare formations with precise measurement techniques.
By Format
Digital or physical? Interactive trading chart cheat sheets integrate with your platform. The printable chart patterns cheat sheet sits beside your screen for quick reference during market hours.
Choose the price action patterns cheat sheet that matches your specific needs. The best reference isn’t the most comprehensive—it’s the one you’ll actually use.
In this guide, we focus specifically on the pattern formations themselves—the visual signatures that appear across all financial markets. Let’s explore each pattern category in detail, examining what these price formations actually look like and the precise trading actions they signal to the attentive market participant.
Understanding Reversal Chart Patterns and Their Types
Reversal patterns are the market’s warning signals. They appear when exhaustion hits and smart money changes direction. Unlike indicators that lag behind price, these visual formations give you advance notice of potential trend changes.
Why add these to your reversal patterns cheat sheet? Because they occur at critical market turning points where profit potential is highest.
Bearish Reversal Patterns (End of Uptrends)
Double and Triple Tops work like pressure tests. The price tries multiple times to break higher but fails, showing buying exhaustion. The psychology is revealing—bulls make repeated attempts at new highs but can’t sustain momentum. Watch for increasing volume on the breakdown below the neckline for confirmation.
Head and Shoulders offers precision entry points other patterns can’t match. The telltale three-peak formation isn’t random—it represents a gradual transfer of control from buyers to sellers. The right shoulder’s failure to reach the head’s height is your early warning signal.
Rising Wedge patterns compress price into an increasingly narrow channel where something must give. The steeper support line creates the illusion of strength while hiding diminishing momentum. Traders who master this pattern catch reversals earlier than most.
Bullish Reversal Patterns (End of Downtrends)
Double and Triple Bottoms aren’t just mirror images of their bearish counterparts. They form differently because fear behaves differently than greed. The repeated tests of support show persistent buying at specific price levels where value investors step in.
Inverse Head and Shoulders provides the clearest profit targets of any reversal pattern. That neckline-to-head measurement forecasts your upside target with surprising accuracy. No guesswork required.
Falling Wedge offers earlier entries than most patterns. While others wait for confirmation, experienced traders recognize the converging trendlines with declining volume as early signs that selling pressure is exhausting.
Understanding Continuation Patterns and Their Types
Unlike reversal patterns that signal market turning points, continuation patterns reveal temporary pauses in strong trends. They’re the market’s way of catching its breath before the next powerful move in the same direction.
Adding these to your trading chart patterns cheat sheet gives you the confidence to hold winning positions through normal consolidation periods—where inexperienced traders often exit prematurely.
Bearish Continuation Patterns (During Downtrends)
Bearish Flags offer the highest probability entries in trending markets. Their brief, counter-trend consolidation appears as parallel lines sloping against the primary downtrend. What makes flags unique is their clearly defined entry triggers and precise profit targets based on the initial “flagpole” movement.
Bearish Pennants compress price into increasingly narrow triangles after sharp declines. Unlike flags with parallel boundaries, pennants feature converging trendlines. The psychology is revealing—selling pressure temporarily exhausts itself, but buyers lack conviction to push prices higher, creating the perfect continuation setup.
Descending Triangles combine a flat support level with declining resistance. This pattern shows sellers becoming increasingly aggressive while buyers remain consistent at a specific price level. The horizontal support eventually gives way when buyers capitulate, creating an acceleration point in the downtrend.
Inverted Cup & Handle formations offer early warning signals before major breakdowns. The rounded dome represents gradual distribution by institutional traders, while the handle shows the final consolidation before continuation. Volume typically diminishes during formation—watch for the spike on breakdown.
Bullish Continuation Patterns (During Uptrends)
Bullish Flags capture the natural rhythm of strong uptrends—surge, consolidate, repeat. The brief pullback within parallel channels represents profit-taking and position adjustment rather than genuine selling pressure. Smart traders use these consolidation zones for low-risk entry points.
Ascending Triangles reveal accumulation in progress. The horizontal resistance with rising support shows persistent buying pressure that eventually overwhelms sellers at the resistance level. Unlike symmetrical triangles that can break either way, ascending triangles have a strong upward bias.
Bullish Pennants form when momentum traders pause but refuse to take profits. The tight consolidation in a symmetrical triangle shows neither buyers nor sellers gaining ground—until the impulsive continuation move resolves the standoff in favor of the primary trend.
The power of continuation patterns lies in their reliability—they complete successfully far more often than reversal patterns, making them essential additions to any comprehensive trading strategy.
Read also What is Technical Analysis for Crypto Trading
Understanding Bilateral Patterns and Their Types
Bilateral patterns can break in either direction. Unlike other patterns on your cheat sheet chart patterns guide, these don’t predict which way price will go. They just tell you a big move is coming.
These patterns form when buyers and sellers reach a standoff. When one side finally wins, price often makes a strong, fast move. This makes bilateral patterns valuable trading opportunities.
The Symmetrical Triangle
This pattern shows lower highs and higher lows that squeeze price into a narrowing range.
When a symmetrical triangle forms, it shows that neither buyers nor sellers dominate the market. Price compresses until it breaks out. Most stock chart pattern cheat sheet guides won’t tell you this secret: these patterns break with the prevailing trend roughly 60% of the time.
Smart approach: Don’t guess the breakout direction. Plan for both possibilities and act only when price shows its hand.
The Rectangle Pattern
Rectangles form when price bounces between flat support and resistance levels.
This pattern shows buyers and sellers fighting at clear price boundaries. Each test of these levels creates trading opportunities. Many bullish chart patterns cheat sheet resources miss this fact: the longer a rectangle takes to form, the bigger the eventual breakout.
Trading tip: Use the height of the rectangle to set your profit targets and determine position size.
The Broadening Formation
Unlike most patterns, broadening formations show price swings getting wider, not narrower.
This pattern reveals growing market disagreement. The widening swings show increasing uncertainty. A key insight missing from many cheat sheet trading patterns: these formations appear more often at market tops than bottoms.
Risk note: These patterns need wider stops due to the increasing swings. Consider smaller positions than you’d use for other patterns.
The Diamond Pattern
This rare pattern combines widening price swings followed by narrowing swings.
The pattern starts with expanding moves then shifts to contracting moves. Diamonds often form at major turning points after long trends. Measure the widest part of the diamond to project potential profit targets.
For all bilateral patterns, patience pays off. Don’t try to predict the breakout direction. Instead, prepare for both scenarios and act decisively when price makes its move.
Neutral Chart Patterns Cheat Sheet
Neutral chart patterns show markets in balance. They form when neither buyers nor sellers have control, creating sideways price movement with no clear direction.
These patterns appear during periods of uncertainty. They often mark times when traders are waiting for important news or economic data before making decisions.
Rectangle Patterns
Rectangles form when price bounces between flat support and resistance levels.
These patterns create a channel-like formation with clearly defined boundaries. Price moves back and forth between these levels until eventually breaking out. Extended rectangle formations often lead to more powerful breakouts.
Trading tip: Rectangles offer multiple strategies. Some traders play the bounces between levels, while others wait for the breakout. The pattern height gives you a reliable method for setting profit targets after breakouts.
Symmetrical Triangles
When price creates both lower highs and higher lows, forming converging trendlines, you’re seeing a symmetrical triangle.
This pattern shows gradually decreasing volatility as price range compresses. The pattern needs at least two touches of each trendline to be valid. Breakouts typically happen around halfway to three-quarters of the way toward the apex where the trendlines converge.
Trading insight: Watch the volume pattern. Volume typically decreases as the triangle forms, then surges on the true breakout. False breakouts rarely show this volume confirmation.
Broadening Formations
Broadening patterns display expanding price swings between widening trendlines.
Unlike most patterns that show compression, these reveal increasing volatility. They form when market participants have increasingly divergent views. These patterns often signal unhealthy market conditions and typically resolve with a significant move.
Trading approach: These patterns require greater caution than other neutral formations. It’s wise to wait for a confirmed breakout and retest before entering a trade.
Recognizing neutral patterns can reveal key market transition zones. Rather than becoming frustrated by sideways price action, you can spot these patterns developing and prepare for the eventual breakout.
How to Effectively Use a Chart Pattern Cheat Sheet?
A chart pattern cheat sheet helps you make faster trading decisions. Learning to use it effectively can significantly improve your trading results. Here’s how to get the most from this powerful tool.
Study First, Trade Later
Before making real trades, study each pattern thoroughly. Take time to understand what each formation means and how it typically plays out. You can analyze historical charts to find examples of each pattern and observe what happened after they formed.
Many traders test their pattern recognition skills with paper trading first. It’s a great way to build trading confidence without putting real money on the line.
Apply Market Context
Never use patterns in isolation. Always consider the broader market environment:
- Overall market trend (bull or bear market)
- Sector performance
- Trading volume
- Support and resistance levels
- Recent news and events
During high volatility periods, patterns may behave differently than during calm markets. Adjust your expectations accordingly.
Verify with Multiple Timeframes
Check if the pattern appears on multiple timeframes. A pattern that shows up on both daily and weekly charts carries more weight than one visible on just a single timeframe.
This multi-timeframe approach is especially important in crypto markets, where price movements can be more extreme than in traditional markets.
Confirm with Volume
Volume often tells you whether a pattern will succeed or fail. Look for:
- Decreasing volume during pattern formation
- Increasing volume during breakouts
- Low volume during false breakouts
Volume patterns are among the most reliable confirmation tools available to traders.
Keep Improving Through Research
Trading evolves constantly. Dedicate time to research new pattern variations and how they perform in different market conditions. Keep your cheat sheet updated with notes from your own trading experience.
The most valuable chart pattern cheat sheet is one that includes your personal observations about what works best for your trading style and preferred markets.
Top 5 Mistakes to Avoid When Using Trading Patterns
Traders stumble repeatedly when implementing chart patterns. Here are critical missteps:
1. Premature Pattern Execution
Novice traders act on partially developed formations. They recognize three points of a wedge and immediately position themselves. Complete patterns require all structural elements present. Hasty decisions undermine profitability.
2. Context Blindness
Individuals examine patterns in isolation from market environment. They spot reversal signals during established momentum phases. Environmental factors often override localized formations. Pattern success depends on broader conditions.
3. Selective Vision Syndrome
Participants modify chart analysis to match preconceived ideas. They adjust boundaries until desired patterns emerge. Objectivity dissolves when bias dominates interpretation. Accurate reading demands neutral assessment.
4. Single-Dimensional Analysis
Many restrict observation to singular chart intervals. They overlook macro developments visible across expanded periods. Comprehensive evaluation requires a multi-interval perspective. Pattern reliability improves with layered examination.
5. Risk Protocol Abandonment
Pattern enthusiasm overshadows protective measures. Traders bypass position sizing and exit planning. This oversight amplifies account vulnerability. Systematic risk parameters remain essential regardless of setup quality.
Combining Your Trading Patterns Cheat Sheet with Additional Tools
Your pattern cheat sheet gains exponential power through strategic tool pairing. Modern trading platforms integrate oscillators like Stochastic alongside formation detection, creating profitable dual-confirmation setups.
Experienced traders employ ATR (Average True Range) for dynamic stop placement within pattern structures. Volume-weighted metrics help confirm real breakouts, and sentiment indicators offer clues into market mood. Platform-based correlation tools reveal pattern synchronization across related assets.
Effective combinations emerge through systematic testing. Begin with pattern-RSI convergence strategies, then incorporate volatility bands. Many platforms offer programmable alerts triggering when patterns align with selected indicators. This multi-dimensional approach significantly elevates trading precision beyond standalone pattern recognition.
FAQs
Which Trading Pattern Delivers the Best Results?
No single pattern dominates across all market conditions – effectiveness varies with trading style and current volatility levels. Flag patterns excel in trending markets, while double tops/bottoms perform better during consolidation phases.
Are Trading Patterns Always Reliable?
Patterns operate on probabilities, not guarantees – even textbook formations fail approximately 30-40% of the time. Market context and volume confirmation significantly impact pattern reliability.
Which Chart Type is Preferred by Most Traders?
Candlestick charts dominate among active traders due to their visual clarity of price action. Professional traders often combine candlesticks with volume histograms for comprehensive analysis.
Start a Cryptocurrency exchange
Try our crypto exchange platform
Disclaimer: Please keep in mind that the content of this article is not financial or investing advice. The information provided is the author’s opinion only and should not be considered as direct recommendations for trading or investment. Any article reader or website visitor should consider multiple viewpoints and become familiar with all local regulations before cryptocurrency investment. We do not make any warranties about reliability and accuracy of this information.
Read more
EOS is definitely on the list of the strongest and most stable projects in the crypto world. Despite the fact that the currency entered the market less than 3 years ago, it consistently occupies one of the top 10 places in the rating for project capitalization. it is often called the “main competitor of Ethereum”. […]
XRP price prediction 2026-2027: bear, base, and bull scenarios with ranges and named sources, the resolved SEC case, live spot ETFs, and can XRP reach $10?
In this article we will talk about Ripple (XRP) and its price prediction. What is Ripple (XRP) Ripple is a San Francisco-based startup that was launched in 2012 by Ripple Labs as a global network both for cross-currency and gross payments. Ripple history began in 2004 with the discussions around the digital coin in the […]
You may well think that an article dedicated to a Tether price prediction or the Tether price in general is a little bit strange — it is a stablecoin after all. However, the price of Tether does fluctuate significantly, although it is nowhere near as volatile as non-stablecoin cryptos. This means that staying up to […]
In the article we share our vision at Zcash cryptocurrency main features and add several price predictions. As cryptocurrencies gain global acceptance and decentralisation slowly enters our lives, privacy becomes the main concern when talking about blockchain adoption. It is no secret that distributed ledger is by far the most secure and transparent technology ever […]
Chiliz coin (CHZ) offers a compelling opportunity for traders interested in the intersection of blockchain technology and sports. By enabling fans to influence team decisions through the Socios app, Chiliz directly monetizes fan engagement and connects with major sports teams like Juventus and Paris Saint-Germain. These partnerships not only enhance the platform’s visibility but also […]