 Alex Tamm
Table of Contents
Last updated: April 2026
Bitcoin is trading at roughly $66,470 as of early April 2026, down 47% from its all-time high of $126,000, set just six months ago. The Fear & Greed Index sits between 8 and 12, the lowest sustained reading since the FTX collapse in late 2022. So: is this the bottom, or is there more pain ahead?
The honest answer, and the starting point for any serious btc price prediction in 2026, is that nobody knows, and anyone who claims certainty is selling something. What we can do is compile what the most credible analysts and institutions (Standard Chartered, Bernstein, JPMorgan, Fundstrat, Ark Invest, and others) are actually forecasting, examine the on-chain data and macro conditions driving those forecasts, and present the bull, base, and bear scenarios with specific price targets. That is what this article does. You decide which scenario matches your own risk assessment.
This is not financial advice. It is a structured synthesis of publicly available expert predictions, market data, and historical patterns.
Where Bitcoin Stands Right Now (April 2026)
Before diving into predictions, here is the snapshot that frames everything:
| Metric | Value |
|---|---|
| BTC Price | ~$66,470 |
| All-Time High | $126,000 (October 2025) |
| Drawdown from ATH | ~47% |
| Market Cap | ~$1.33 trillion |
| Fear & Greed Index | 8 to 12 (Extreme Fear) |
| YTD Performance | Jan: -10.1%, Feb: -14.8%, Mar: +0.19% |
| BTC Supply Mined | 19.95M of 21M (95%+) |
| ETF AUM | ~$86.9B (down from $170B peak) |
| Fed Funds Rate | 3.50% to 3.75% (held March 2026) |
| Expected Rate Cuts | 2 cuts, Sep + Dec (Goldman Sachs est.) |
The context matters more than the number. This is not 2022. There is no exchange collapse, no contagion event, no Celsius or Terra or FTX. What happened is simpler: Bitcoin ran parabolically through 2025, peaked at $126,000 in October, and corrected sharply. The infrastructure underneath (spot ETFs managing nearly $87 billion, over 170 public companies holding BTC on their balance sheets, and increasing regulatory clarity in both the US and EU) is stronger than at any prior drawdown.
The sentiment, however, is as bad as it has ever been. The Fear & Greed Index hit an all-time low of 5 on February 6, 2026, lower than during the Terra/Luna collapse, lower than during COVID. That disconnect between sentiment and fundamentals is the central tension of the current market and the reason this article exists.
Bitcoin Price Prediction 2026: What Experts Say
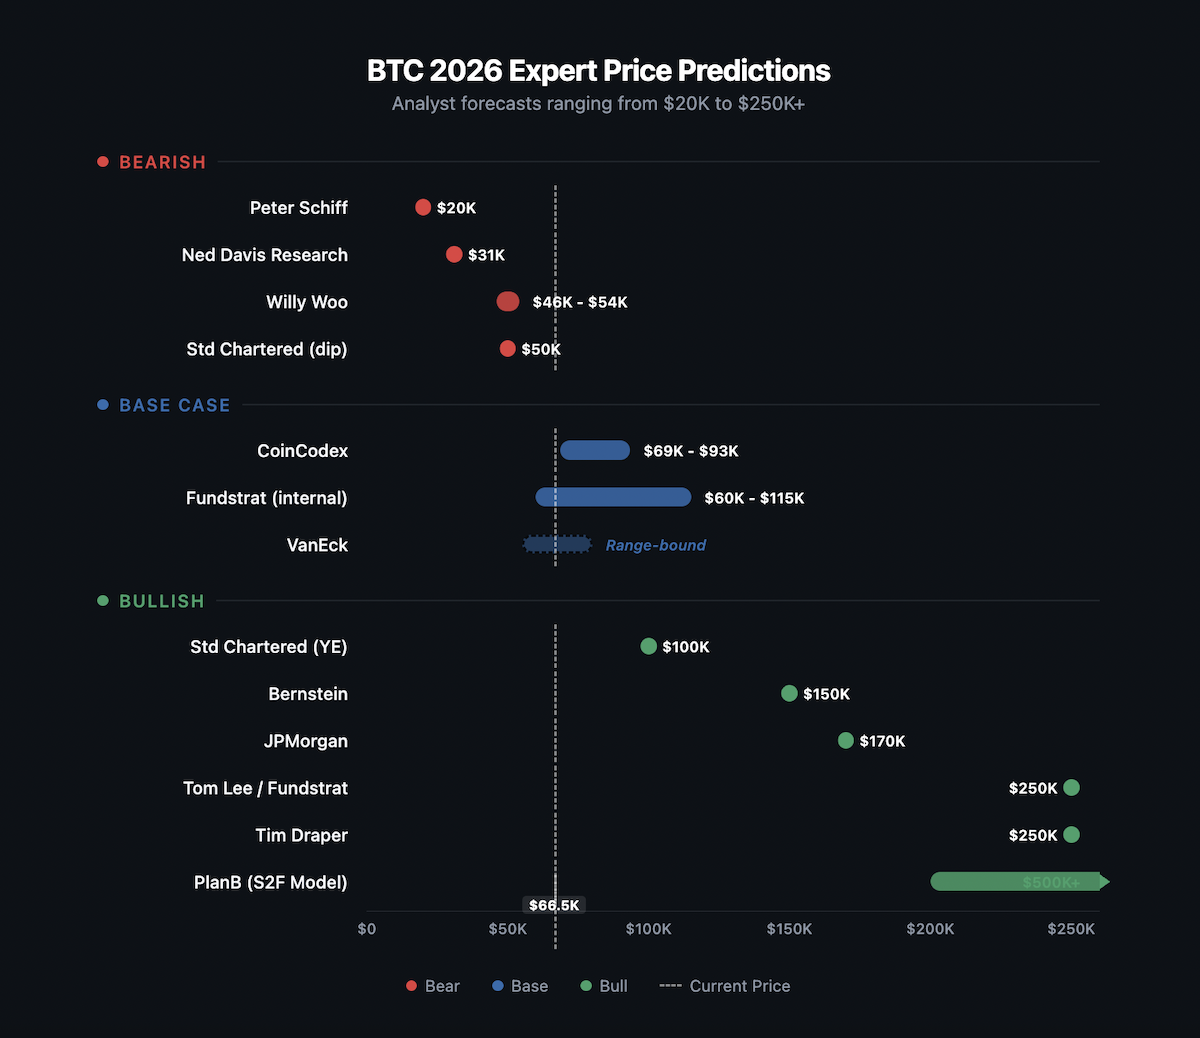
Rather than listing every bitcoin forecast for 2026 alphabetically, we have organized them by scenario. Each includes named sources, specific targets, and the reasoning behind the call.
Bull Case ($100K to $250K)
Standard Chartered, $100,000 year-end. Analyst Geoff Kendrick has revised this target downward three times: from $300,000 (mid-2025) to $150,000 (December 2025) to the current $100,000 (February 2026). The repeated revisions are worth noting. They suggest a forecast chasing price rather than leading it. Standard Chartered does expect a possible dip to $50,000 before recovery, which makes this more of a “V-shaped recovery” thesis than a pure bull call.
Bernstein, $150,000 year-end. Bernstein’s research team has maintained this target through the drawdown and argues that the current correction represents what they call the “weakest bear case in history,” meaning no systemic failures, no major exchange collapses, just a garden-variety correction after a parabolic run. Their thesis: the bull cycle is elongated, not over, with a peak closer to $200,000 by end of 2027.
JPMorgan, $170,000 near-term. JPMorgan’s model, based on Bitcoin’s volatility ratio to gold, produces a $170,000 near-term target. A separate thought experiment (what if Bitcoin captured gold’s full market-cap equivalent?) yields $266,000. The bank has publicly stated it is bullish on institutional crypto inflows for the remainder of 2026. Worth noting: the $266,000 figure is a theoretical ceiling, not a 2026 price call.
Tom Lee / Fundstrat, $250,000 (public) vs. $115,000 (internal). Tom Lee’s public target remains $250,000. However, leaked internal Fundstrat documents showed a more sober year-end target of $115,000 and warned clients to expect a $60,000 to $65,000 dip in the first half. Lee’s public framing, a “year of two halves” with a tough H1 and strong H2, is more nuanced than the headline number suggests. The gap between the public and internal numbers is instructive.
Tim Draper, $250,000. The venture capitalist has been calling for $250,000 since 2018 and has pushed the target date back multiple times. In February 2026, he declared it a “bonanza year” and offered a Polymarket bet on the target. His track record on timing is poor, though his long-term directional call (BTC going much higher) has been correct in absolute terms.
Cathie Wood / Ark Invest, no current 2026 target (earlier $500,000 call missed). Wood made an explicit $500,000 call for 2026 back in 2021, which has clearly not materialized. Ark Invest has since shifted its focus to 2030, where their models project a bull case of $2.4 million and a bear case of $500,000. Wood argues that institutional capital is fundamentally disrupting the traditional four-year cycle. The failed 2026 prediction is itself a useful data point: even prominent bulls with strong long-term conviction can be off by years on timing.
PlanB (Stock-to-Flow model), $500,000 average for the 2025 to 2028 window. The Stock-to-Flow model, which maps Bitcoin’s price to its supply scarcity ratio, is perhaps the most debated quantitative framework in crypto prediction. PlanB’s model suggests the current cycle peak could arrive in 2026, 2027, or 2028, a wide window that reduces its near-term predictive utility. He has also warned against over-relying on four-year cycles with only three historical data points. The S2F model called for $100,000+ by late 2021 and was years early. Its value is directional rather than precise: it argues that post-halving supply shocks eventually produce significant price increases, even if the timing is unreliable.
Bull catalysts to watch: Resumption of sustained ETF inflows, Fed rate cuts in H2 2026, continued institutional accumulation, and regulatory clarity from the pending US framework.
Base Case ($80K to $115K)
Fundstrat (internal), $115,000 year-end. As noted above, the leaked internal forecast is significantly below Tom Lee’s public call. It anticipates a first-half bottom around $60,000 to $65,000 followed by a recovery driven by macro improvements and ETF flows.
VanEck, consolidation year, new ATH possible but not a melt-up. Matthew Sigel of VanEck described 2026 as “more likely a consolidation year than a melt-up or a collapse.” CEO Jan van Eck suggested in March 2026 that BTC may be forming a bottom. No explicit price target, but the framing implies range-bound trading with upside potential.
Matrixport, range-bound, event-driven. Matrixport’s analysis points to high volatility without a clear directional trend, with price action driven by discrete events (ETF flow reports, Fed meetings, geopolitical developments) rather than a sustained move in either direction.
CoinCodex (algorithmic), $68,575 to $93,376 range. Their model, based on technical indicators, projects a 2026 range with a July peak around $91,261 and a December close near $77,473. As of their last update, 22 of 29 indicators were bearish.
Base case catalysts: Status quo macro conditions, gradual institutional accumulation, no major catalyst in either direction.
Bear Case ($20K to $65K)
Willy Woo, $46,000 to $54,000 on-chain floor. On-chain analyst Willy Woo’s models place the structural floor in this range. He expects weeks of additional consolidation and has warned of a potential “bull trap.” His most serious caution: if US equity markets break down meaningfully, Bitcoin enters “uncharted territory” and the floor models may not hold.
Standard Chartered, $50,000 near-term dip. Before their $100,000 year-end target, Kendrick expects a possible drop to $50,000, a further 25% decline from current levels.
Ned Davis Research, $31,000 worst case. Based on historical peak-to-trough patterns, which have seen 70 to 75% drawdowns in prior cycles. Not their base case, but a scenario they consider plausible. The average Bitcoin bear market has lasted 225 days; the current drawdown stood at roughly 129 days as of their analysis.
Peter Schiff, $20,000. The gold advocate and lifelong Bitcoin skeptic predicted a financial crash “worse than 2008” and said BTC holders would be “substantially poorer” by year-end 2026. Schiff has been predicting Bitcoin’s demise since it traded in the hundreds of dollars. His directional call has been consistently wrong, but his function in any prediction roundup is to define the extreme lower bound.
Bear catalysts to watch: Escalation of the Iran conflict (oil prices already up 60%, feeding inflation fears), accelerating ETF outflows, a hawkish surprise from the Fed, and the concentration risk from Strategy (formerly MicroStrategy) holding 762,099 BTC. If they were ever forced to sell, the impact would be systemic.
A note on track records: predictions are only as good as the analyst’s history. Standard Chartered has been revising downward all year. Bernstein has been consistent. Schiff has been wrong for over a decade. Draper has been directionally right but wrong on timing by years. Weight these forecasts accordingly.
Bitcoin Price Prediction by Month (2026)
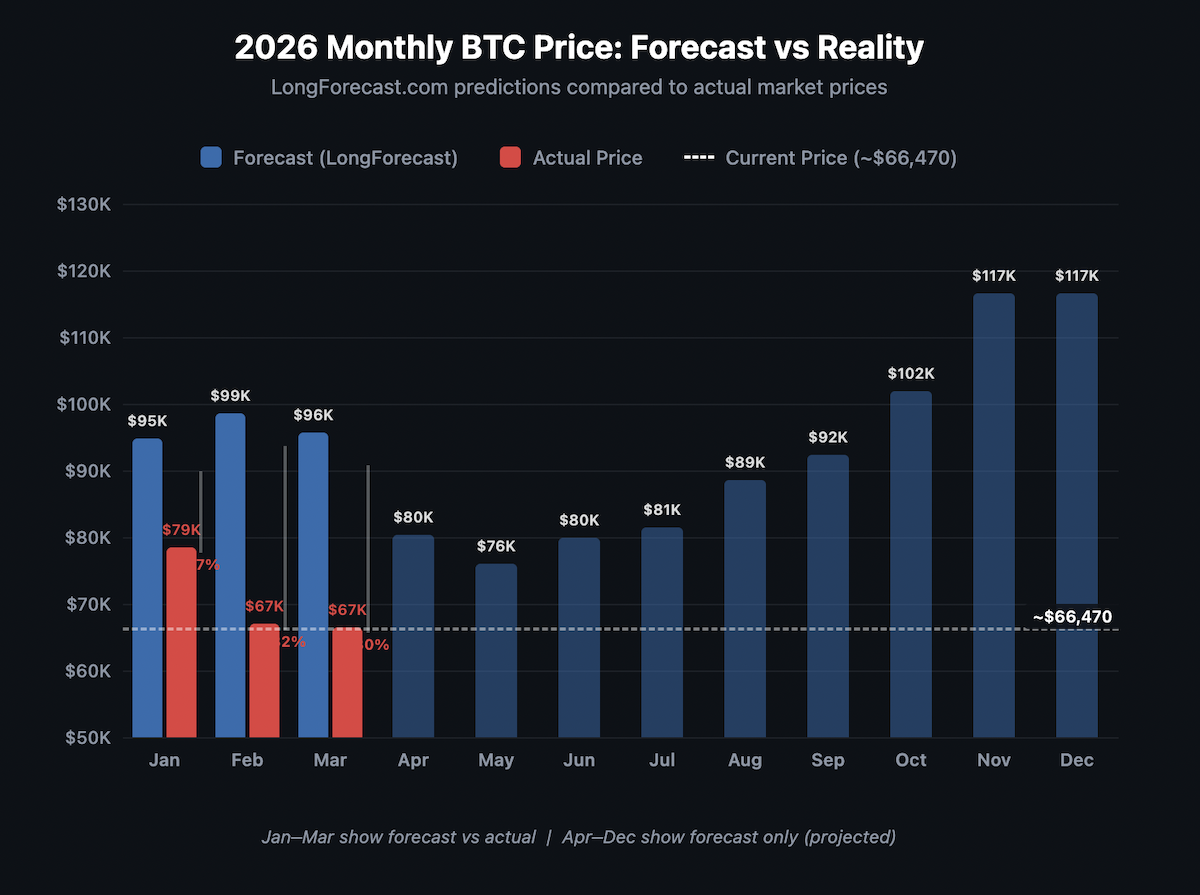
Monthly price tables are standard in every ranking prediction article, so here is the data. These figures are sourced from LongForecast’s algorithmic model, which extrapolates from historical patterns and technical indicators.
| Month | Low | Average | High | Change (M/M) |
|---|---|---|---|---|
| January | — | $78,500 (actual) | — | -10.1% |
| February | — | $67,000 (actual) | — | -14.8% |
| March | — | $66,500 (actual) | — | +0.19% |
| April | $74,693 | $80,315 | $95,613 | -16.0% |
| May | $70,724 | $76,047 | $81,370 | -5.3% |
| June | $74,345 | $79,941 | $85,537 | +5.1% |
| July | $75,768 | $81,471 | $87,174 | +1.9% |
| August | $81,471 | $88,575 | $94,775 | +8.7% |
| September | $85,844 | $92,305 | $98,766 | +4.2% |
| October | $92,305 | $101,849 | $108,978 | +10.3% |
| November | $101,849 | $116,548 | $124,706 | +14.4% |
| December | ~$116,548+ | — | — | — |
Source: LongForecast.com algorithmic model. CoinCodex projects a narrower 2026 range of $68,575 to $93,376.
Before you treat these numbers as targets, consider this: LongForecast predicted Bitcoin would open January 2026 at $88,172 and close at $94,788. The actual January close was approximately $78,500. February’s forecast was $98,594; the actual close was roughly $67,000. The model overestimated Q1 by 20 to 40%.
Algorithmic models extrapolate from historical patterns. They cannot account for black swan events, geopolitical shocks, or sudden shifts in institutional behavior. The pattern these models suggest (a weak first half bottoming around April to June, followed by a recovery in H2 and a potential return above $100,000 by Q4) is directionally interesting but should be treated as a rough guide, not a roadmap.
CoinCodex’s model, which is more conservative, shows a 2026 range of $68,575 to $93,376 with a July peak near $91,261. Their sentiment analysis had 22 of 29 indicators bearish at last check. The gap between the two models illustrates how much uncertainty exists even among algorithmic approaches using similar data.
The Halving Cycle Question: Is the 4-Year Pattern Dead?
The Bitcoin halving, when the block reward is cut in half, has historically been the most reliable predictor of major price cycles. The most recent halving occurred on April 20, 2024, reducing the reward from 6.25 BTC to 3.125 BTC per block.
Here is what happened after each previous halving:
| Halving Year | 1-Year Return | Peak Multiple |
|---|---|---|
| 2012 | +5,219% | ~100x |
| 2016 | +1,219% | ~30x |
| 2020 | +645% | ~8x |
| 2024 | +31% | ~2x (so far) |
Note: the table shows one-year snapshot returns. The 2024 cycle’s peak return was ~98% (ATH of $126,000 from a $63,762 halving-day price), reached at roughly 18 months post-halving, consistent with prior cycle timing patterns. The peak multiple itself, however, is the weakest on record.
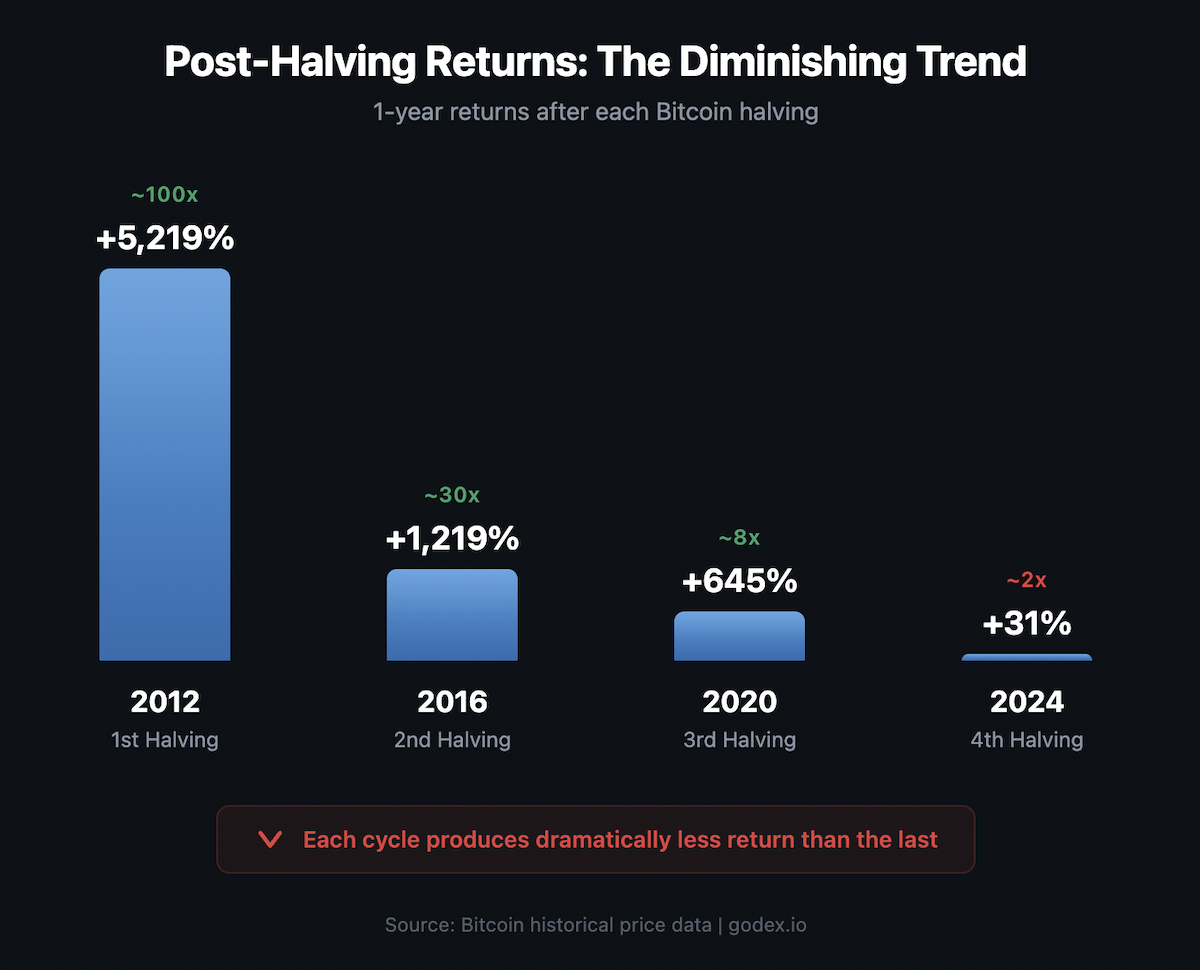
The diminishing returns trend is unmistakable. But the 2024 cycle also broke new ground: it was the first cycle where Bitcoin set a pre-halving all-time high ($73,000 in March 2024, one month before the halving). By October 2025, BTC had reached $126,000, a ~98% rally from the halving-day price of $63,762.
So is the four-year cycle dead?
Opinions are split. Cathie Wood of Ark Invest argues that institutional capital is “disrupting” the four-year pattern, compressing what used to be a retail-driven boom-bust into a more sustained, structurally supported trend. Epoch Ventures has declared the “end of the 4-year cycle” outright.
The counter-argument: the cycle may be elongating, not dying. With diminishing returns as the baseline expectation (each cycle producing a smaller multiple but from a higher base), the 2024 cycle’s peak may not arrive until 2027, consistent with an 18 to 24 month post-halving peak window. VanEck’s Matthew Sigel supports this view, arguing the four-year cycle “remains intact” but that 2026 is a consolidation year within it.
The next halving is estimated for March or April 2028. If the cycle-elongation thesis holds, the next 12 to 18 months become an accumulation window. If the cycle-death thesis holds, macro and institutional flows matter more than the calendar.
Key Factors That Will Move Bitcoin in 2026
ETF Flows
Spot Bitcoin ETFs hold approximately $86.9 billion in assets under management as of late March 2026, down from a peak of roughly $170 billion in October 2025, a decline that tracks the price drawdown almost perfectly. BlackRock’s IBIT alone holds 782,180 BTC ($52.8 billion), making it the single largest Bitcoin vehicle in the world.
The flow picture is mixed. Early 2026 saw five consecutive weeks of outflows totaling $4.5 billion. But March 2026 brought $2.5 billion in inflows, the strongest monthly figure since mid-2025. Grayscale’s GBTC has seen cumulative outflows of $25.9 billion since its conversion to a spot ETF, though the pace has slowed considerably.
The potential catalyst: Morgan Stanley is reportedly nearing the launch of its own Bitcoin ETF, which would bring a major wirehouse distribution network into the market. ETF trading volumes are already up over 40% year-over-year.
Institutional Adoption
CoinGecko tracks 164 institutions with confirmed on-chain or publicly reported Bitcoin holdings, totaling 1,791,150 BTC, or 8.53% of the total supply. Broader estimates that include pending acquisitions and smaller holders put the number between 170 and 190 publicly traded companies.
The concentration issue is hard to ignore. Strategy (formerly MicroStrategy) holds 762,099 BTC, accounting for 76% of all corporate Bitcoin holdings. The next four largest holders (Twenty One Capital with 43,514 BTC, MARA Holdings with 38,689 BTC, Metaplanet with 35,102 BTC, and BSTR with 30,021 BTC) combined still hold less than a fifth of Strategy’s position.
Beyond Strategy, corporate buying has collapsed. At the August 2025 peak, non-Strategy companies were accumulating roughly 69,000 BTC per month. That figure has dropped to approximately 1,000 BTC per month, a 99% decline. Trump Media (DJT) made headlines with an 11,542 BTC purchase, but that appears more like a political signal than a corporate treasury trend.
US Strategic Bitcoin Reserve
President Trump signed an executive order establishing a Strategic Bitcoin Reserve on March 6, 2025. One year later, it remains unoperationalized. The 30-day and 60-day deadlines outlined in the order were missed without action. Congress has not passed enabling legislation.
The US government currently holds approximately 328,372 BTC from law enforcement seizures, making it one of the largest known state holders. Senator Cynthia Lummis has reintroduced the BITCOIN Act, which proposes acquiring 1 million BTC over five years, ambitious but facing significant legislative hurdles.
State-level action has been more concrete: Texas made a $5 million IBIT purchase, New Hampshire signed HB 302, and Arizona’s HB 2749 allows investment of seized crypto assets. These are small in dollar terms but meaningful as political signals.
Regulation: MiCA and the US Framework
The EU’s Markets in Crypto-Assets regulation (MiCA) has a critical deadline approaching: July 2026, when all Crypto-Asset Service Providers (CASPs) must achieve full compliance. Over EUR 540 million in penalties have already been issued. The Anti-Money Laundering Authority (AMLA) is launching in 2026 for direct supervision of the largest cross-border crypto firms.
MiCA creates regulatory clarity but increases compliance costs. Some smaller EU-based exchanges may exit the market rather than comply, which could consolidate volume toward larger platforms.
In the US, there is still no comprehensive crypto regulatory framework, though the CFTC is gaining jurisdiction over certain crypto assets. The net effect globally: legitimization of the asset class paired with consolidation of the industry.
Macro Environment
The Federal Reserve held rates at 3.50% to 3.75% at its March 2026 meeting. Goldman Sachs expects two rate cuts in the second half, September and December. Rate cuts have historically been supportive of risk assets, including Bitcoin, but the current geopolitical environment complicates the picture.
The ongoing Iran conflict, which escalated into broader regional tensions in early 2026 disrupting Middle Eastern oil supply routes, has driven oil prices up approximately 60%, renewing inflation fears that could delay or reduce the expected rate cuts. Bitcoin’s correlation with traditional risk assets remains elevated during downturns, meaning a significant equity market selloff would likely drag BTC lower regardless of crypto-specific fundamentals.
Mining Economics
JPMorgan estimates Bitcoin’s marginal production cost at approximately $77,000 per BTC. With Bitcoin trading at ~$66,470, the market is currently pricing BTC below what it costs to mine, a condition that has historically been unsustainable. In prior cycles, sub-production-cost pricing has led to miner capitulation (hashrate declines as unprofitable miners shut down), followed by difficulty adjustments and eventual price recovery. Network hashrate is already declining, confirming that this process is underway. The bull read: every prior instance of BTC trading below production cost was followed by a recovery above it. The bear read: if broader markets deteriorate further, the production cost floor may not hold, and the capitulation could deepen before it resolves.
Bitcoin Supply: The Scarcity Argument
The supply math is straightforward and bullish on a long enough timeline. Of Bitcoin’s hard-capped 21 million supply, approximately 19.95 million have been mined, over 95%. The 20 million milestone was reached around March 2026.
But the effective circulating supply is much lower. Estimates suggest 3 to 4 million BTC are permanently lost (inaccessible wallets, lost keys, early-era coins that have never moved), putting the functional supply closer to 16 million.
Post-halving, miners produce roughly 450 BTC per day, or about 164,000 per year. At this rate, 99% of all Bitcoin will be mined by approximately January 2035. The final Bitcoin will not be mined until around 2140.
ETFs and institutions now hold increasingly large portions of the available supply. BlackRock’s IBIT alone holds 782,180 BTC. If demand returns to 2025 levels while new supply has been halved, the supply squeeze thesis suggests meaningful upward price pressure. The caveat: that “if” is doing a lot of work, and demand is not guaranteed to return on any particular timeline.
Bitcoin Price Prediction 2027 to 2030
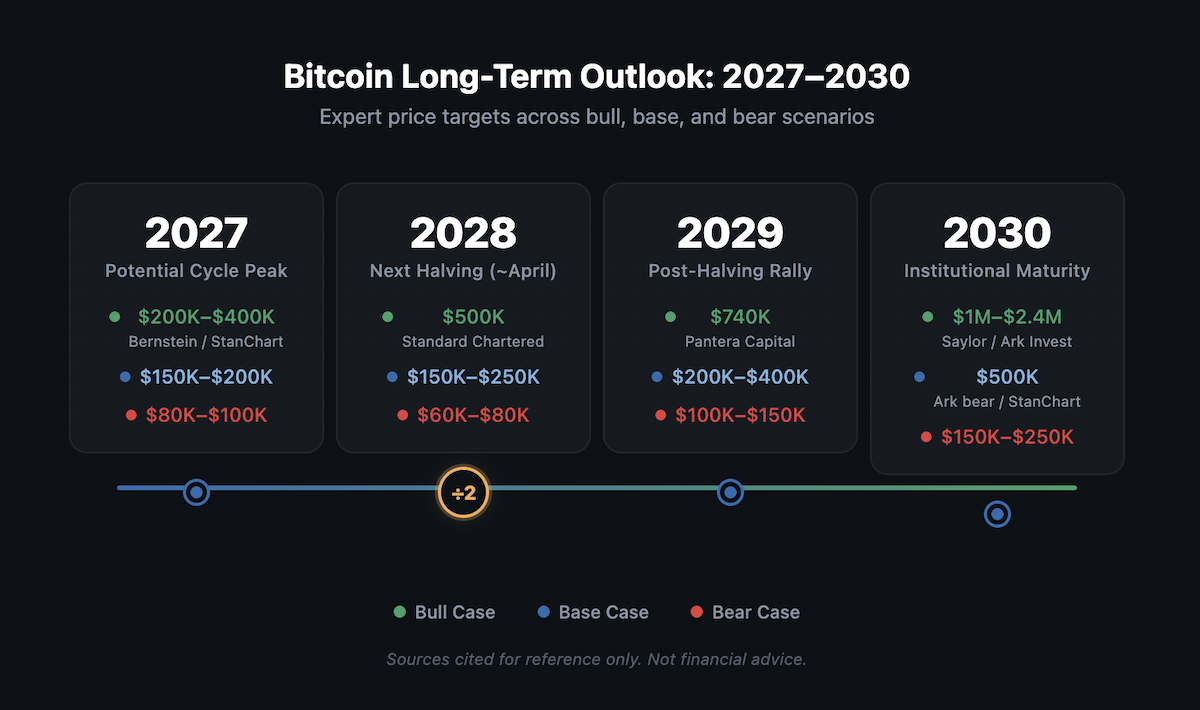
For readers with a longer time horizon, here is how major analysts see the next several years:
| Year | Bull Case | Base Case | Bear Case | Key Event |
|---|---|---|---|---|
| 2027 | $200K (Bernstein) / $400K (StanChart) | $150K to $200K | $80K to $100K | Potential cycle peak |
| 2028 | $500K (StanChart) | $150K to $250K | $60K to $80K | Next halving (~April) |
| 2029 | $740K (Pantera Capital) | $200K to $400K | $100K to $150K | Post-halving rally |
| 2030 | $2.4M (Ark bull) / $1M (Saylor) | $500K (Ark bear / StanChart) | $150K to $250K | Institutional maturity |
2027 is where the elongated-cycle thesis converges. Both Bernstein (cycle peak near $200,000) and Standard Chartered ($400,000) see 2027 as the year of peak returns for this cycle. If the four-year pattern holds in stretched form, this is when the post-2024-halving rally would climax.
2028 brings the next halving, estimated for March or April. Standard Chartered’s $500,000 target for this year assumes Bitcoin has matured into a macro asset comparable to gold. Historically, halving years themselves have been mixed; the fireworks come in the 12 to 18 months following.
2029 is the post-halving sweet spot if history rhymes. Pantera Capital’s $740,000 target is the most specific institutional call for this period. LongForecast’s algorithmic model, for whatever that is worth, projects a December 2029 close around $206,294.
2030 is where forecasts diverge most dramatically. Cathie Wood’s Ark Invest models a bull case of $2.4 million and a bear case of $500,000, a 5x spread. Michael Saylor’s $1 million target sits in the middle. Standard Chartered targets $500,000. The range is enormous because it depends on variables that are genuinely unknowable today: regulatory frameworks, institutional adoption curves, monetary policy, and geopolitical stability.
The spread between bull and bear cases widens with each year, which is not a flaw in the analysis. It is an honest reflection of compounding uncertainty.
Contrarian Signals: What History Says About Extreme Fear
The Fear & Greed Index is at levels most investors have never seen. On February 6, 2026, it hit an all-time low of 5, lower than during the Terra/Luna collapse, lower than during COVID’s initial crash, lower than during the FTX bankruptcy.
Historically, this has been a contrarian indicator worth watching. Analysis of Fear & Greed Index data since 2020 suggests that readings below 10 have been followed by positive 14-day returns in roughly three out of four instances, with a median gain of approximately 12% within two weeks.
Does that mean Bitcoin is a buy right now? Not necessarily. Each crisis is different, and the sample size is small. The Iran conflict, the ETF outflow cycle, and the uncertainty around the Federal Reserve’s path are all factors that did not exist in the same combination during prior extreme fear episodes.
What the data does suggest: historically, the moments when the market is most convinced Bitcoin is finished have been among the most favorable entry points for those with a multi-month or multi-year horizon. That pattern may hold again, or this time may genuinely be different. The data is suggestive, not conclusive.
FAQ: Bitcoin Price Prediction 2026
Will Bitcoin reach $100K in 2026?
Standard Chartered’s current year-end target is $100,000, and their analyst Geoff Kendrick expects a recovery in the second half driven by Fed rate cuts and returning ETF inflows. Bernstein and JPMorgan are targeting $150,000+, which implies crossing $100,000 along the way. Algorithmic models from LongForecast project BTC above $100,000 by October. However, CoinCodex’s more conservative model caps its 2026 range at $93,376. Consensus: $100,000 is achievable in H2 2026 if macro conditions improve and ETF flows turn sustainably positive. It is not a certainty.
Will Bitcoin hit $150K in 2026?
Bernstein maintains a $150,000 year-end target and has not wavered through the drawdown. JPMorgan’s volatility-adjusted model points to $170,000. Reaching $150,000 from current levels would require a 126% rally, significant but not unprecedented in Bitcoin’s history. This is a bull case, not a base case, and would likely require multiple catalysts firing together: Fed cuts, sustained ETF inflows, and no escalation on the geopolitical front.
Is Bitcoin a good investment in 2026?
That depends entirely on your timeframe and risk tolerance. The long-term structural case (fixed supply approaching its cap, institutional infrastructure via ETFs, growing regulatory acceptance) is stronger than at any point in Bitcoin’s history. The short-term picture is volatile: a 47% drawdown, extreme fear sentiment, and unresolved macro headwinds. Investors with a multi-year horizon have historically been rewarded for buying during extreme fear. Traders with a shorter timeframe face significant risk of further downside. This is not financial advice; assess your own situation and do your own research.
What will Bitcoin be worth in 2030?
Long-range forecasts cluster in a wide band. Cathie Wood’s Ark Invest models a bull case of $2.4 million and a bear case of $500,000. Standard Chartered targets $500,000. Michael Saylor has called for $1 million. Two more halving events will occur between now and 2030 (2028 and the beginning of the 2032 cycle), further reducing new supply. The consensus among institutional analysts sits roughly between $500,000 and $1 million, but the honest answer is that any 4-year forecast in crypto carries enormous uncertainty.
Will Bitcoin crash in 2026?
It already has, by most definitions. A 47% decline from the all-time high qualifies. Whether further downside awaits depends on which analyst you trust. Willy Woo’s on-chain models suggest a floor between $46,000 and $54,000. Ned Davis Research warns of a possible $31,000 worst case based on historical drawdown patterns (70 to 75% from peak). Peter Schiff calls for $20,000, though his Bitcoin predictions have been consistently wrong for over a decade. On the other side, Bernstein argues this correction involves no systemic failures, making it structurally different from prior crashes.
Is the Bitcoin halving cycle still relevant?
The debate is live. The 2024 halving produced the weakest one-year returns on record: just +31%, compared to +5,219% after 2012, +1,219% after 2016, and +645% after 2020. Diminishing returns have been the pattern since the first halving, so the 2024 numbers may simply be the continuation of a well-established trend, not evidence the cycle is broken. Some analysts, like Cathie Wood, argue institutional capital has disrupted the four-year pattern. Others, like VanEck’s Matthew Sigel, believe the cycle remains intact but is elongating. The next halving is estimated for March or April 2028, which will provide the next major data point.
The Bottom Line
Bitcoin in April 2026 sits at the intersection of historically extreme fear and structurally sound fundamentals. The expert forecasts compiled here range from $20,000 (Schiff) to $250,000 (Draper), a spread so wide that no single number serves as a reliable prediction. What matters more than any specific target is the catalysts you are watching and the timeframe you are operating on.
The base case from most institutional analysts: a difficult first half of 2026, with potential for recovery in H2 if Fed rate cuts materialize and ETF inflows resume. The long-term case, across nearly every credible source, remains structurally bullish, driven by fixed supply, institutional adoption, and the maturing ETF infrastructure.
Whatever your outlook, whether you are accumulating BTC, rotating into altcoins during the drawdown, or moving to stablecoins to preserve capital, the ability to act quickly matters when markets shift. A non-custodial exchange with fixed-rate swaps and no KYC requirements lets you lock in the price you see, not the price you get three days later after identity verification clears. With 934+ supported assets, that is exactly what Godex.io is built for: execute in 3 to 15 minutes, maintain full custody of your funds, and keep your identity out of the equation.
Markets move faster than verification queues. Plan accordingly.
Start a Cryptocurrency exchange
Try our crypto exchange platform
Disclaimer: Please keep in mind that the content of this article is not financial or investing advice. The information provided is the author’s opinion only and should not be considered as direct recommendations for trading or investment. Any article reader or website visitor should consider multiple viewpoints and become familiar with all local regulations before cryptocurrency investment. We do not make any warranties about reliability and accuracy of this information.
Read more
EOS is definitely on the list of the strongest and most stable projects in the crypto world. Despite the fact that the currency entered the market less than 3 years ago, it consistently occupies one of the top 10 places in the rating for project capitalization. it is often called the “main competitor of Ethereum”. […]
XRP price prediction 2026-2027: bear, base, and bull scenarios with ranges and named sources, the resolved SEC case, live spot ETFs, and can XRP reach $10?
In this article we will talk about Ripple (XRP) and its price prediction. What is Ripple (XRP) Ripple is a San Francisco-based startup that was launched in 2012 by Ripple Labs as a global network both for cross-currency and gross payments. Ripple history began in 2004 with the discussions around the digital coin in the […]
You may well think that an article dedicated to a Tether price prediction or the Tether price in general is a little bit strange — it is a stablecoin after all. However, the price of Tether does fluctuate significantly, although it is nowhere near as volatile as non-stablecoin cryptos. This means that staying up to […]
In the article we share our vision at Zcash cryptocurrency main features and add several price predictions. As cryptocurrencies gain global acceptance and decentralisation slowly enters our lives, privacy becomes the main concern when talking about blockchain adoption. It is no secret that distributed ledger is by far the most secure and transparent technology ever […]
Chiliz coin (CHZ) offers a compelling opportunity for traders interested in the intersection of blockchain technology and sports. By enabling fans to influence team decisions through the Socios app, Chiliz directly monetizes fan engagement and connects with major sports teams like Juventus and Paris Saint-Germain. These partnerships not only enhance the platform’s visibility but also […]